
Spatial analysis of factors impacting lower limb major amputation rates in Hungary
Is geography partially destiny?
Abstract
Summary:Background: Lower limb major amputations represent a substantial public health burden in Hungary, where previous research revealed markedly high rates with significant spatial variations. Therefore, we aimed to assess to what extent healthcare and socio-economic factors in the local environment explain the regional disparity. Patients and methods: In a retrospective cohort analysis, based on the healthcare administrative data of the Hungarian population, lower limb major amputations were identified from 1st of January 2017 to 31st of December 2019. The permanent residence of the amputees on the local administrative level (197 geographic units) was used to identify potential healthcare (outpatient care, revascularisation activity) and socio-economic (educational attainment, local infrastructure and services, income and employment) determinants of amputations. Spatial effects were modelled using the spatial Durbin error regression model. Results: 10,209 patients underwent 11,649 lower limb major amputations in the observational period. In our spatial analysis, outpatient care was not associated with local amputation rates. However, revascularisation activity in a geographic unit entailed an increased rate of amputations, while revascularisations in the neighbouring areas were associated with a lower rate of amputations, resulting in an overall neutral effect (β=−0.002, 95% CI: −0.05 – 0.04, p=0.96). The local socio-economic environment had a significant direct inverse association with amputations (β=−7.45, 95% CI: −10.50 – −4.42, p<0.0001) . Our spatial model showed better performance than the traditional statistical modelling (ordinary least squares regression), explaining 37% of the variation in amputations rates. Conclusions: Regional environmental factors explain a substantial portion of spatial disparities in amputation practice. While the socio-economic environment shows a significant inverse relationship with the regional amputation rates, the impact of the local healthcare-related factors (outpatient care, revascularisation activity) is not straightforward. Unravelling the impact of the location on amputation practice requires complex spatial modelling, which may guide efficient healthcare policy decisions.
Introduction
Lower limb major amputations represent a considerable public health burden due to their contribution to population morbidity and mortality and severe economic consequences [1]. This problem is especially crucial in the Central Eastern European countries (CEECs), where increased rates of amputations signal a divide compared to the Western European countries (WECs) [2, 3]. For example, in Hungary, a member of CEECs, the high and variable rates of lower limb major amputations is alarming [3, 4, 5]. In addition, amputations are also considered an essential quality indicator of peripheral arterial disease and diabetes care, which represent the main risks for limb loss [6, 7]. However, the trends in amputation statistics are thought to be determined by a complex interplay between the risk in demography, comorbidity, socio-economic characteristics and health service performance. Consequently, the interpretation of potential determinants is challenging [8, 9].
Amputation rates are markedly varying in different countries (between-countries variation) [3] and different regions and subregions of the same country (within-country variation). Data on the latter differences are available from the United States [10], the United Kingdom [11], Finland [12], Spain [13], Germany [14], and the Netherlands [15]. In addition, we have previously shown that in Hungary, the regional variations in amputation rates in neighbouring smaller areas are higher than randomly expected, indicating a possible spatial association between amputation rates and regional characteristics [5].
According to a recent policy statement from the American Heart Association (AHA), measures need to be taken to explore and attenuate regional disparities observed in amputation practice [9]. When unravelling the determinants of regional differences in amputation practice, not only the unique characteristics of the amputees (age, sex, comorbidity, individual socio-economic status), but the regional disparities in the living environment should be also considered [16, 17]. Regarding the latter, attempts were made to find an association between factors in the health domain [18, 19, 20, 21] and in the broader socio-economic environment (SEE) [22, 23, 24].
Our analysis, first from the CEECs, aimed to explore whether regional lower limb major amputation rates are associated with different factors (general healthcare, vascular care, and SEE) in the living environment of the amputees. Additionally, we also aimed to assess and correct for potential spatial interaction between adjacent geographic areas.
Methods
Study design
Retrospective cohort study based on healthcare administrative data.
Database
The HUNVASCDATA project aims to analyse healthcare administrative data on vascular diseases in the entire Hungarian population [4]. For this project, data were acquired from the database of the National Health Insurance Fund, which is the single healthcare financer in Hungary. It covers all in-patient (hospital) and outpatient services in the country that are examined in our study. In Hungary, the proportion of people not in governmental healthcare insurance system is lower than 5%. Importantly, the procedures that were used to define our study population are not performed in the private sector. Consequently, our study population covers the whole Hungarian population.
Data were extracted based on codes from the International Classification of Diseases, tenth revision (ICD-10), and the International Classification of Procedures in Medicine (ICPM). In the analysis, the only unique identifier of the patients, the insurance number, was encrypted with a one-way hash function so that no patients’ identities were disclosed. This process ensured anonymous handling of patient data, but still produced a unique record for each healthcare beneficiary that could be linked between databases. Due to the lack of identifiable individual data, Institutional Review Board approval to conduct this study was not required. The data on the healthcare and socio-economic variables from local administrative units (LAU 1) were acquired from the National Regional Development and Spatial Planning Information System (TeIR, https://www.teir.hu/).
Reporting was performed according to the Strengthening the Reporting of Observational Studies in Epidemiology (STROBE) guideline for observational studies [25] and its extension for routinely collected health data (Reporting of studies Conducted using Observational Routinely collected health Data – RECORD statement) [26].
The research was conducted according to Act XLVII of 1997 on the Management and Protection of Healthcare and Related Personal Data in Hungary, and the Declaration of Helsinki.
Study population
All patients over 18 years of age in the entire beneficiary population who underwent lower limb major amputation were identified. All variables are averages of data from 1st of January 2017 to 31st of December 2019 to minimise potential fluctuations between individual years. Detection of amputation events was based on the identification of specific ICPM codes (ICPM 58470: crural amputation, 58480: femoral amputation, 58471: ankle amputation). To obtain a homogeneous patient population of vascular and/or diabetic patients, we excluded cases that were associated with trauma or bone/skin malignancies. In addition to the basic demographic characteristics, each patient’s permanent residence was identified at the geographic LAU 1 level.
Geographic data
Our regional analysis was based on the Nomenclature of Territorial Units for Statistics (NUTS) classification that was developed by Eurostat to facilitate regional statistics and to target political interventions at the regional level (Regulation [EC] No 1059/2003 of the European Parliament). This system includes three hierarchical levels of geographic units (NUTS 1–3: large regions, planning and statistical regions, and counties) that are complemented by two additional local administrative units (LAU 1 and 2: statistical subregions and settlements, respectively) [27].
The analysis was based on the LAU 1 level. In Hungary, there are 197 regions at this level of geographic resolution, with an average area of 529 km2 and an average population size of 49,000 inhabitants living in an average of 18 settlements. Maps of Hungary (down to the LAU 1 level) were obtained from the OpenStreetMap project in ESRI-compatible shapefiles [28].
Outcome and explanatory variables
Our primary outcome variable was the lower limb major amputation rate (on LAU 1 level) adjusted for age and sex. Amputation rates at the LAU 1 level were obtained for the period of 1st of January 2017 to 31st of December 2019. Background population counts for the same strata for each LAU 1 unit were obtained from the Hungarian Central Statistics Office from the database NT5C01 [29]. The crude incidences of amputation rates were directly standardised using the European Standard Population 2013 (ESP 2013) as a reference to obtain age- and sex-adjusted estimates.
Our explanatory variables were lower limb revascularisation referrals, outpatient care and SEE. Regional lower limb revascularisation (open vascular surgery or endovascular) referral activity was assessed using crude (unstandardised) procedure rates from 1st of January 2017 to 31st of December 2019, referred from each LAU 1 units.
Individual indicators of outpatient care availability, activity and SEE are highly correlated (causing collinearity issues in the regression analysis) and are likely describing the same, few latent constructs. Thus, we used principal component analysis (PCA) to summarise multiple parameters of these variables into one summary construct.
The outpatient care variable, which was constructed from five parameters (general practitioner availability, the number of general practitioners per population, the number of pharmacy offices per population and the number of appointments in angiology or vascular surgery outpatient services) was determined on the LAU 1 level.
SEE was calculated from 17 variables characterising educational attainment, local infrastructure and services, income and employment, all of which were calculated on the LAU 1 level. All explanatory variables are summarised (including definitions, formation, and data source) in the electronic supplementary material [ESM] 1.
Statistical analysis
First, we applied univariate and multivariate ordinary least squares (OLS) linear regression to analyse the association between general health care, SEE, lower limb vascular procedures and amputation rates. Next, we analysed the residuals from the multivariate linear regression model using Moran’s I test to assess whether there is any spatial autocorrelation in our model [30]. As our results yielded a considerable amount of spatial dependence in our residuals, we used spatial regression models with queen’s neighbourhood matrix to account for the spatial dependence in our data [31]. These models may consider three additional predictors other than the given LAU 1 value of the predictors: 1) spatially lagged Xs, which are a weighted sum of the neighbouring predictors; 2) spatially lagged Ys, in which the weighted sum of the neighbouring outcomes also affects a given region’s outcome; and 3) spatially autocorrelated errors, in which the residual of a region is also a function of the neighbours’ residuals [32, 33]. Adding all three to the regression model results in the Manski model. However, this model is only partially defined and may result in inaccurate estimates. Therefore, two submodels are usually considered: the spatial Durbin model (SDM), which considers spatially lagged Xs and Ys, and the spatial Durbin error model (SDEM), which has spatially lagged Xs and autocorrelated errors [31, 33]. We empirically choose the SDEM, which has no spatially lagged Ys, as an a priori hypothesis, as we did not consider the possibility of a neighbouring region’s amputation rate affecting the given region’s amputation rate directly.
The SDEM model can be reduced to the spatially lagged X (SLX) model by removing the spatially correlated errors and to the spatial error model (SEM) by removing the spatially lagged X terms. In a top-to-bottom approach, we considered these more parsimonious models and the OLS model (in which both terms are removed from the model) by comparing the fit of these models to that of the SDEM using the likelihood-ratio test. If the fit did not deteriorate significantly, then the more parsimonious model was chosen.
In the case of the SDEM and the SEM, the effects of our predictors can be partitioned into direct, indirect and total effects [32]. The direct effect indicates the average association between the predictor and the outcome in the same geographical region (LAU). The indirect effect (lag coefficient) represents the average change in the outcome in a given region (LAU) as a result of the neighborhood predictors. The total effect is the sum of the two effects.
Two-sided p-values smaller than 0.05 were considered statistically significant.
All statistical calculations were performed in the R environment (v.4.0.1) using the packages psych (v2.1.3); rgdal (v1.5-23 and v.2.3.1); spdep (v.1.1-8) and spatialreg (v.1.1-8) [34, 35]. The analytic script file can be accessed at https://github.com/tamas-ferenci/AmputationEpidemiologyInHungary
Results
Population characteristics of the local administrative units
Overall, 197 LAUs were analysed from Hungary. The median population of the LAUs was 35,846 inhabitants (IQR: 23,057 – 59,747), and the average age was 40.2±1.8 years. The physical and demographic characteristics of LAU 1 geographic units can be found in ESM 2.
Lower limb major amputations
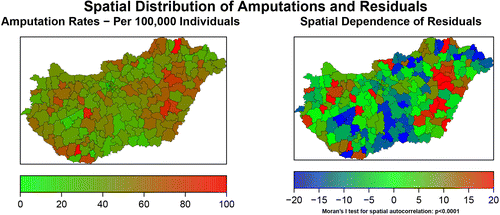
From 1st of January 2017 to 31st of December 2019, 11,649 amputation procedures affecting 10,209 patients (aged 69.8±10.9 years, 7702 [66.1%] male) were identified in the entire beneficiary population. The average amputation rate was 56.1±18.4 per 100,000 inhabitants (range 14.6 – 124). The spatial pattern amputations (on LAU 1 level) can be seen in Figure 1.
Socio-economic and healthcare-related data
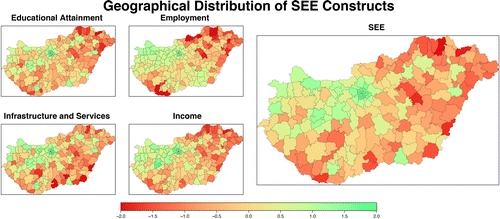
Geomapping of SEE constructs (educational attainment, employment, income, infrastructure and services) and the resulting SEE parameter (range: −2.0 to +2.5) created using PCA is shown in Figure 2. The findings are in accordance with the known regional disparities in Hungary (disproportionally higher performance in SEE in the central region, which includes the capital with lower SEE status in the northeast and southwest region). Maps of outpatient care constructs are presented in Figure 3. While general practitioner and pharmacy coverage reflect a deficiency in the periphery (small settlements), a high level of inequalities in the number of general practitioners and appointments for angiology, vascular surgeon service indicate a regional shortage in the physician workforce. The composite map of outpatient care constructs (range: −2.6 to +2.0) represents variations in structural characteristics of service.
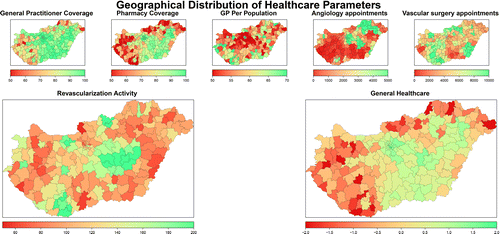
Lower limb revascularisation activity (open vascular surgery or endovascular), as crude rates are displayed in Figure 3. Rates ranged from 59.5 to 286.8 (average 107.4) per 100,000 inhabitants.
Ordinary least squares regression results
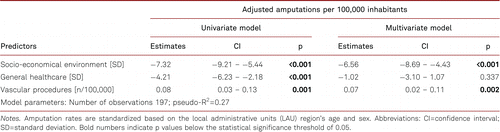
Univariate OLS regression indicated that both SEE and general health care were associated with decreased amputation rates (β= −7.32, 95% CI: −9.21 – −5.44, p<0.001; β=−4.21, 95% CI: −6.23 – −2.18, p<0.001; respectively), while each vascular procedure per 100,000 inhabitants was associated with a 0.08 increase in amputation rates per 100,000 (95% CI: 0.03 – 0.13, p=0.001). In the multivariate model, SEE was independently associated with a reduction in amputation rates by 6.56 per 100,000 inhabitants (95% CI: −8.69 – −4.43, p<0.001), and for each vascular procedure, amputations increased by 0.07 per 100,000 (95% CI: 0.02 – 0.11, p=0.002). Outpatient care did not show a significant association with amputation rates in the multivariate model. Overall, the model explained 27% of the variation in amputation rates. Results are presented in Table I.
The residuals from the multivariate model indicated significant residual autocorrelation (Figure 1; Moran’s I test: standard deviation=4.77, p<0.0001).
Spatial regression models
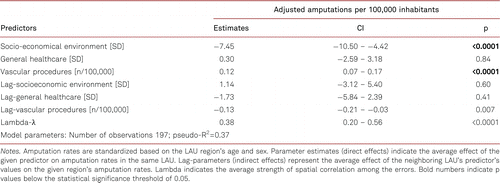
As the geographical location was a significant contributor to amputation rates, we went on to model the potential spatial interactions between the covariates in our model using spatial regression. The SDEM model provided the best fit to our data and therefore was used for analysis (ESM 3).
The SDEM model indicated that SEE had a direct effect that significantly lowered amputation rates in the given LAU (β=−7.45, 95% CI: −10.50 – −4.42, p<0.0001), while the indirect effect (spillover) of the neighbouring LAUs’ SEE values was not significant (β=1.14, 95% CI: −3.12 – 5.40, p=0.60). This resulted in a total effect of SEE lowering amputation rates (β=−6.31, 95% CI: −9.72 – 2.90, p<0.0001). In the case of outpatient care, none of the effects was significant (p>0.05 for all). However, each vascular procedure in a given LAU resulted in an increase in the number of amputations in that LAU by 0.12 (95% CI: 0.07 – 0.17, p<0.0001), while increases in the neighbouring LAUs’ procedure rates was indirectly associated with lower amputation rates in the given LAU (β=−0.13, 95% CI: −0.21 – −0.03, p=0.007). This resulted in a non-significant total association between vascular procedures and amputation rates (β=−0.002, 95% CI: −0.05 – 0.04, p=0.96). Residuals analysis indicated that factors unaccounted for in the model are spatially autocorrelated (λ=0.38, 95% CI: 0.20 – 0.56, p<0.0001). The model was able to explain 37% of the variation in the data. Detailed results are presented in Table II.
Discussion
Considering lower limb major amputations as an indicator of failure in vascular and diabetes care, Hungary (and other CEECs) shows higher amputation rates as compared to WECs [2, 36]. In addition to the higher procedure rates in these countries, substantial regional within-country variations have also been described [5]. To better understand this phenomenon, we aimed to explore the health, and in a broader sense, the socio-economic environmental determinants of the within-country spatial variation of lower limb major amputations.
In our analysis, we first performed the traditional form of regression analysis to explore the relationship of the regional pattern of amputations on LAU 1 level with several potential explanatory factors on the same geographic scale. This model was able to account for 27% of the variation in amputation across the country. Multivariate regression analysis revealed an inverse correlation between amputation rates and SEE; in contrast, outpatient care was not associated with the amputation rates. Importantly, revascularisation activity in a given geographic unit was associated with a significant increase in amputations. However, simple regression analysis does not correct for spatial autocorrelation and does not consider the potential spatial interplay between the parameters.
Therefore, we decided to carry out a spatial regression analysis (SDEM) that can take the potential neighbouring effects of geographic units also into account. This model outperformed the traditional technique, explaining 37% of the variation in lower limb major amputations.
According to the results of this analysis, the outpatient care composite variable was not associated with any change in amputation rates in a given region. However, our composite variable was much more influenced by the structural characteristics of outpatient care (availability of general practitioners, pharmacies or vascular outpatient clinics). Considering the Donabedian concept [37], which separates structure, process and outcome indicators of care, the composite variable lacked the power to signal the quality of process in care service. This might explain why our results conflicted with those of Lago Franco et al., for example, who revealed an inverse association between local amputation rates and diagnostic examinations (colour Doppler ultrasound) in a spatial model [20]. Unfortunately, we could not acquire similar process indicator data measuring general or vascular outpatient care with the required spatial granularity (LAU 1 level).
Our second health-related construct, the regional referral rates for lower limb vascular procedures, represents a process indicator of regional vascular care. In contrast to the results of the ordinary regression model (positive association), in the SDEM model, in addition to a positive direct impact (increase in vascular procedures entails higher amputation rates in an area), a negative indirect effect (more vascular procedures in the neighbouring areas is associated with lower amputation rates in a given geographic unit) was also detected. These two kinds of spatial associations resulted in a neutral total effect. Literature data regarding the association between regional amputation and revascularisation rates are inconclusive: while Lago Franco et al. reported a positive correlation, an inverse relationship was found by Goodney et al. [18] and later by Mestral et al. [38]. However, the latter analyses were limited to amputees and thus included only a portion of patients with critical limb ischaemia; moreover, only the spatial pattern of their preceding revascularisations was considered. As a consequence, a considerable number of vascular procedures in patients who avoided amputations were not considered. Furthermore, they did not observe an inverse relationship between regional amputation rates and spending on vascular procedures [18, 19].
A positive association between the number of revascularisations and amputation rates is counterintuitive and challenging to interpret. However, several conditions need to be considered when interpreting the results. First, similarly to others, we could not identify cases with definite critical limb ischaemia separately. Creating a case definition of critical limb ischaemia using administrative data would require complicated algorithms with varying accuracies [39]. Second, elective surgeries presumably appeared in our dataset. Such surgeries reflect the treating vascular surgeon’s discretion to treat or not treat during the intermittent claudication phase and therefore may bias the regional associations between revascularisations and lower limb major amputation. Third, cross-sectional analyses have limited power to analyse the inherently time-dependent relationship between the parameters. For example, in Hungary, due to an austerity reform in health care, the rates of vascular procedures markedly declined in 2007, but that was not followed by a rise in amputations [4]. Fourth, the association between vascular procedures and amputations may show regional differences. For example, in areas of low SEE, the beneficial effect of revascularisation may be limited if individuals with low socio-economic status do not adhere to the optimal postprocedural surveillance and preventive care (lifestyle, medication) that is needed to preserve vascular patency [40]. Nevertheless, our observation of an inverse spillover effect of revascularisation on amputation rates from the areas adjacent to a given location indicates the relevance of enhancing surgical or endovascular activity in a broader area.
Our third construct was formed to explore how the non-healthcare-related variables of SEE (employment, income, educational attainment, local infrastructure and services) influence amputations. The concept of improving the living environment to prevent health inequalities is straightforward [41]. However, data on the effect of SEE on amputation rates are scarce, especially from Europe [22, 23]. To our knowledge, our study is the first to analyse this question in a spatial model incorporating regional aspects in the analysis (e.g., spillover from adjacent areas). A definite inverse relationship (an increase in SEE resulted in a decrease in amputations) was found with the OLS model and the SDEM. However, no indirect (spillover) effect was revealed. Our observation that improving SEE may have a significant beneficial impact on amputation practice is an important message for policymakers. SEE affects all efforts to prevent events like amputations, and consequently, it requires a multilevel and multidisciplinary approach involving public health measures [42].
Accordingly, in harmony with the recent AHA statement on amputations [9], a broader view for policy decision-makers can be recommended to reduce the number of limb losses and mitigate regional disparities in amputation practice. It should also involve non-direct healthcare-related aspects that may lead to an actionable policy (regulatory/legislative and organisational/institutional changes) in this field.
Nevertheless, although our spatial model was able to explain a considerable amount of variation in lower limb major amputations, the remaining error of the model showed spatial autocorrelation, indicating that spatial patterns in the unmeasured variables are also influential. Therefore further research is needed to explore the determinants of amputation practice.
Limitations
First, our analysis is a spatio-epidemiological investigation; therefore, patient-level risk factors, such as comorbidities could not be considered in our analysis. Nevertheless, amputation rates were age- and sex-adjusted estimates, thereby correcting a major possible confounding factor. Second, our analysis is cross-sectional; therefore, we cannot conclude causation from the associations identified. Third, similar to OLS, spatial regression provides a global estimate of the effects of covariates on the outcome, while the explanatory variables may have different associations in different geographical regions. Fourth, while PCA allows building a composite of latent concepts such as SEE, the scale of the parameter is arbitrary, and as a result, the magnitude of the beta coefficient cannot be compared to other variables (e.g. revascularisation rates). Fifth, considering the environmental determinants of the amputation practice, country-specific differences may not be excluded.
Conclusions
Our spatial regression analysis indicated that the different aspects of the living environment, independently from the individual characteristics of the amputees, are associated with the regional variation of the lower limb major amputations. In our model, a substantial portion of the variation in amputation practice could be explained by the geographic location. Correcting for spatial effects, the neighbouring socio-economic status showed a significant inverse relationship with the number of amputations, while the impact of the local healthcare service (general and vascular) was not straightforward. Without correcting for spatial effects, we would have arrived at a different conclusion. Our results may contribute to the wider application of more sophisticated modelling tools in this field and help healthcare policymakers arrive at more adequate decisions as spatial effects of interventions may also need to be considered. Our results show that geography is at least partially destiny in medical care.
Electronic supplementary material
The electronic supplementary material (ESM) is available with the online version of the article at https://doi.org/10.1024/0301-1526/a000995
References
1 . Diabetes-related amputations create considerable public health burden in the UK. Diabetes Res Clin Pract. 2018;135:158–65.
2 . Lower limb major amputation data as a signal of an east/west health divide across Europe. Eur J Vasc Endovasc Surg. 2020;60(5):645–6.
3 International variations in amputation practice: A VASCUNET Report. Eur J Vasc Endovasc Surg. 2018;56(3):391–9.
4 Lower limb amputations and revascularisation procedures in the Hungarian population: A 14 year retrospective cohort study. Eur J Vasc Endovasc Surg. 2020;59(3):447–56.
5 . Regional variation of lower limb major amputations on different geographic scales – a Hungarian nationwide study over 13 years. VASA. 2020;49(6):500–8.
6 Indicators of outcome quality in peripheral arterial disease revascularisations – a Delphi expert consensus. VASA. 2018;47(6):491–7.
7 . Current challenges and opportunities in the prevention and management of diabetic foot ulcers. Diabetes Care. 2018;41(4):645–52.
8 . Potentials, challenges, and limitations of the analysis of administrative data on vascular limb amputations in health care. VASA. 2020;49(2):87–97.
9 Reducing nontraumatic lower-extremity amputations by 20% by 2030: Time to get to our feet: A policy statement from the American Heart Association. Circulation. 2021;143(17):e875–91.
10 Regional intensity of vascular care and lower extremity amputation rates. J Vasc Surg. 2013;57(6):1471–9., 1480 e1471–3; discussion 1479–80.
11 . Lower limb amputation in England: prevalence, regional variation and relationship with revascularisation, deprivation and risk factors. A retrospective review of hospital data. J R Soc Med. 2014;107(12):483–9.
12 . Indicators for comparing the incidence of diabetic amputations: a nationwide population-based register study. Eur J Vasc Endovasc Surg. 2013;46(5):569–74.
13 Major amputations in type 2 diabetes between 2001 and 2015 in Spain: regional differences. BMC Public Health. 2020;20(1):54.
14 . Prevalence and regional distribution of lower limb amputations from 2006 to 2012 in Germany: a population based study. Eur J Vasc Endovasc Surg. 2015;50(6):761–6.
15 . Regional variation in the incidence of diabetes-related amputations in The Netherlands. Diabetes Res Clin Pract. 1996;31(1–3):125–32.
16 “No more amputations”: a complex scientific problem and a challenge for effective preventive strategy implementation on vascular field. Int Angiol. 2017;36(2):107–15.
17 Location, location, location: geographic clustering of lower-extremity amputation among Medicare beneficiaries with diabetes. Diabetes Care. 2011;34(11):2363–7.
18 Regional intensity of vascular care and lower extremity amputation rates. J Vasc Surg. 2013;57(6):1471–9., 1480.e1471–3; discussion 1479–80.
19 Relationship between regional spending on vascular care and amputation rate. JAMA Surg. 2014;149(1):34–42.
20 Spatial inequalities of major lower limb amputation rates in Paraná state, Brazil. BMJ Open. 2020;10(12):e038980.
21 . Health service organisation impact on lower extremity amputations in people with type 2 diabetes with foot ulcers: systematic review and meta-analysis. Acta Diabetol. 2021;58(6):735–47.
22 . The influence of socio-economic deprivation on mobility, participation, and quality of life following major lower extremity amputation in the west of Scotland. Eur J Vasc Endovasc Surg. 2019;57(4):554–60.
23 . Association of neighbourhood deprivation with risks of major amputation and death following lower limb revascularisation. Atherosclerosis. 2020;306:11–4.
24 . Geographic clustering of diabetic lower-extremity amputations in low-income regions of California. Health Aff. 2014;33(8):1383–90.
25 Strengthening the Reporting of Observational Studies in Epidemiology (STROBE): explanation and elaboration. PLoS Med. 2007;4(10):e297.
26 The REporting of studies Conducted using Observational Routinely-collected health Data (RECORD) statement. PLoS Med. 2015;12(10):e1001885.
27 . Regions in the European Union, Nomenclature of territorial units for statistics NUTS 2013/EU-28. Luxembourg: Publications Office of the European Union, 2015.
28 . OpenStreetMap Project. London: OpenStreetMap Foundation (OSMF). Available from https://data2.openstreetmap.hu/hatarok/index.php
29 . KSHStatinfoScraper. Available from https://github.com/tamas-ferenci/KSHStatinfoScraper
30 . Notes on continuous stochastic phenomena. Biometrika. 1950;37(1–2):17–23.
31 . What regional scientists need to know about spatial econometrics. Rev Reg Stud. 2014;44(1):13–32.
32 . How to interpret the coefficients of spatial models: Spillovers, direct and indirect effects. Spatial Demography. 2016;4(3):175–205.
33 . An introduction to spatial econometrics. Rev Écon Ind. 2008;123(3):19–44.
34 . Comparing implementations of global and local indicators of spatial association. TEST. 2018;27(3):716–48.
35 . Comparing implementations of estimation methods for spatial econometrics. J Stat Softw. 2015;63(18):1–36.
36 . A divide between the western European and the central and eastern European countries in the peripheral vascular field: A narrative review of the literature. J Clin Med. 2021;10(16):3553.
37 . The quality of care. How can it be assessed? JAMA. 1988;260(12):1743–8.
38 Regional health care services and rates of lower extremity amputation related to diabetes and peripheral artery disease: an ecological study. CMAJ Open. 2020;8(4):e659–66.
39 Development of administrative data algorithms to identify patients with critical limb ischemia. Vasc Med. 2014;19(6):483–90.
40 . Management of patients after endovascular interventions for peripheral artery disease. Circulation. 2013;128(7):749–57.
41 How could differences in “control over destiny” lead to socio-economic inequalities in health? A synthesis of theories and pathways in the living environment. Health Place. 2016;39:51–61.
42 . Impact of social determinants of health on cardiovascular disease prevention. Curr Opin Cardiol. 2021;36(5):572–9.