Prediction of sports injuries by psychological process monitoring
Abstract
Abstract:Objectives: Sports injuries usually have severe consequences for the concerned athletes as well as for trainers and teams. The question is if accidents can be predicted in specific cases. Can early-warning signals be detected in psychological time series? Methods: An App-based method of process-monitoring was applied for data collection of psychological parameters. Daily self-assessments using a Sports Process Questionnaire were realized by a professional soccer player during the after-care period of a psychiatric treatment. Methods for the prediction of critical events were applied (Dynamic Complexity, Recurrence Plots, dynamic inter-item correlations). Injuries may demarcate pattern transitions in the mental functioning of athletes, which could be identified by the Pattern Transition Detection Algorithm (PTDA). Results: Early-warning signals of the accident could be identified in the time series. Dynamic Complexity revealed a critical instability, Recurrence Plots a transient period, and the dynamic inter-item correlations a period of increased system coherence just before the accident. The PTDA revealed a phase transition at the occurring injury. Conclusions: Even if the analysis is based on a single case, the results are promising. Psychological self-reports allow a short-term prediction of bio-mechanical injuries and by this, can help to prevent them. Nonlinear measures can be applied to time series data collected by digital process monitoring.
Introduction
Sport injuries usually are physically and emotionally disturbing events [1] with substantial incidences [2]. Accidents and injuries may have severe consequences, for those who are affected but also for the sportive environment of the athletes, e.g., teams and trainers [3]. Hence, any kind of prediction or assessment of risk would be helpful, especially if decisions on the participation in games or on the continuation or disruption of training procedures would be possible.
Although sport accidents are biomechanical events, precursors or early-warning signals can be found in psychological parameters and in bio-psychological mechanisms. The potential link between psychological antecedents and the occurrence of sport injuries has been described in some models [4, 5], e.g., classifying risks to personal factors, history of stressors, and coping resources. A growing body of literature shows that stress levels, psychological coping skills, significant lifetime events, and daily hassles can contribute to increased anxiety and depressive symptoms which are linked to the risk of injuries [6, 7]. Athletes experiencing anxiety or depressive symptoms face an increased vulnerability to injuries because of decreased concentration and attention levels during practices and games or/and reduced or insufficient apprehension of threatening stimuli [8, 9]. The impact of executive functions on sports performance is based on processes like anticipation of complex dynamics, fast decision making, movement control, inhibitory control, action-perception cycles, body perception, and others [10, 11]. An impairment of self-efficacy and self-esteem, and the anticipation of failures can have a direct impact on the coordination of cognition, emotion, and movement [11, 12]. The overtraining syndrome [13] affects the cognitive-affective-motoric system, with symptoms as emotional instability, impulsivity, distractibility, restlessness, impaired coordination, impaired information processing, but also listlessness, chronic fatigue, general and competitive anxiety, reduced self-esteem and depression. A similar spectrum of symptoms and mental risk factors is related to athlete burnout [14].
The diversity of bio-psychological predictors suggests a multi-level methodology in forecasting risks. Given that athletes are not in an enduring general risk state, changing states and state dynamics should be considered. This implicates a dynamic systems approach including high-frequency monitoring of multiple time series, indicating when athletes move from a stable state to a risky state. The nonlinearity of complex systems prevents long-term predictions of trajectories and events [15, 16], but – instead of this – creates options for short-term predictions. A multiple time series approach can be based on the continuous measurement of risk indicators, realized by Internet- and App-based self-reporting systems [17]. The methodology moves from a statistical and population-related risk prediction to a person-specific focus on rare events and upcoming changes in the dynamics, as it is known from the prediction of extreme events like earthquakes, avalanches, stock market crashes, tilting ecosystems [18, 19, 20] and psychotherapy [21, 22].
Different methods of time series analysis exist for the prediction of critical events and next to transition dynamics [22, 23, 24, 25], e.g., increased variance, critical slowing down with indicators like increased autocorrelations or autoregression coefficients, spectral reddening (higher variation at low frequencies) close to transitions, and increases in short- and mid-term memory measured by Detrended Fluctuation Analysis. Another interesting characteristics of system dynamics approaching an attractor shift is flickering which is produced by internal or external perturbations or by sensitivity to noise. It mirrors transient, short-term shifts between different alternative regimes before the system breaks its symmetry into one of these attractors. In view of the different methods from many disciplines, we should be aware that in psychology usually time series with only a limited number of measurement points are available. Consequently, we have to apply methods which are eligible for comparatively short time series (e.g., < 100 measurement points) with non-stationary (changing pattern) characteristics, like Dynamic Complexity [23] and Recurrence Plots [24] (see Methods section).
Critical events like sport injuries may implicate qualitative transitions in the mental dynamics of an athlete (so called “phase transitions”). Phase transitions can be identified by applying a recently published Pattern Transition Detection Algorithm [22, 25]. Before and after transitions not only the features of the involved time series are expected to change, but also the network dynamics.
The aim of this study is to identify early-warning signals and changing patterns in the time series of a soccer player who underwent a severe sports injury. We intend (a) to detect early-warning signals (precursors) of the upcoming sports injury in multiple time series taken by daily self-assessments using a sports and training-related process questionnaire, and (b) to apply the Pattern Transition Detection Algorithm to the time series in order to identify the critical event as a phase transition.
Materials and methods
The Sports Process Questionnaire (SPQ)
The time series of the process, before and after the accident, were assessed by a process questionnaire focusing on the mental conditions of athletes (Sports Process Questionnaire, SPQ). The SPQ was developed from the Therapy Process Questionnaire (TPQ), a validated and standardized process questionnaire for high-frequency monitoring of psychotherapeutic change dynamics [26]. The SPQ comprises item clusters which in a strict sense are not statistically derived factors. The items of the “Athlete Burnout” cluster were inspired by the athlete burnout measure proposed by Raedeke and Smith [27]. Table 1 represents the items related to the clusters. Currently, the SPQ is applied to a bigger sample of soccer players at risk of injuries to prepare a validation of the questionnaire by explorative and confirmative factor analysis, as in [26].

The time series of the item clusters were calculated by reversing the item values whose wording goes in the opposite direction of the meaning of the item cluster (e.g., “I succeed to fully exploit my athletic capacity” related to “Athlete Burnout”), averaging the item time series, and finally, applying a z-transformation on the averaged time series. Z-transformed time series move around a mean value of 0 in units of standard deviations.
The Synergetic Navigation System (SNS)
The data of this case study were recorded by the Synergetic Navigation System (SNS) [28, 29], a generic Internet- and App-based system to record, visualize, and analyze change processes and its nonlinear trajectories. “Generic” means that it offers the option to apply different questionnaires up to free choice. The SNS is applicable in diverse fields like psychotherapy, coaching, team development, or professional sports. The evaluation and visualization of the processes allow a collaborative feedback and a data-driven management of change and training processes, e.g., by an athlete and a sports psychologist. The analysis tools which are available in the SNS give evidence for nonlinear patterns and pattern transitions like sudden changes (phase transitions), critical instabilities, or inter-item synchronization.
Time series analysis methods
Before applying any advanced analysis methods, the raw data of the time series and the z-transformed values of the item clusters will be investigated in order to get an impression of changed dynamics before the accident happened. The following linear and nonlinear time series analysis methods were applied:
Dynamic Complexity
Dynamic Complexity (DC) [23, 30] identifies critical instabilities in real-world time series, without specific statistical or parametric assumptions. It mirrors the increased complexity and sensitivity to noise and perturbations of system dynamics before a critical event or a phase transition takes place. DC is the multiplicative product of a fluctuation measure (F) and a distribution measure (D) applied to discrete time series data with given data ranges and constant discrete time intervals between the data points. F is sensitive to the amplitudes and frequencies of a time signal, and D scans the scattering of values or system states within the range of possible values. In order to identify non-stationarity, DC is calculated within a data window sliding along the time series. Because the empirical time series we use in this study were collected by daily ratings, we apply a window width of 7 measurement points.
Recurrence Plots
Recurrence Plots (RP) provide a visualization and quantification of recurrent, i.e. dynamically repeating state values within a time series [24, 31]. Dynamic similarity is measured in terms of metric distances between vector points in a state space. Each vector point represents a small sequence (snippet) of measurement values, and all embedded vector points grasp the whole time series which is projected into a multidimensional state space with a specific embedding dimension m and a time-delay τ. For creating the RPs presented in the Results section we defined 3 time-delay embedding coordinates for each time series with τ = 1. Beside to produce RPs by binary matrices where an entry is 1 if di,j ≤ ε, otherwise it is 0, another option is to produce RPs by calculating the Euclidian distances between all vector points and color coding the distances. The color of each element of the matrix indicates the similarity between the vector points at each time. Blue indicates recurrent (similar) patterns, red non-recurrent (distant or transient) patterns, and all in-between patterns are represented by a rainbow color scale.
Dynamic inter-item correlation
An increase of the synchronization of subsystems or components of a system before critical transitions occur was observed in ecosystems [20], in the emergence of diseases [32], and in psychotherapeutic processes [30, 33]. Here we use the absolute (sign-independent) values of the Pearson correlations between the variables of the system under investigation. The absolute values of the N(N-1)/2 correlations (N is the number of variables or items) are averaged within a moving window (window width = 7). This time-varying averaged correlation can be seen as a measure of the synchronization or coherence of the system dynamics.
The Pattern Transition Detection Algorithm
In order to identify phase transitions (qualitative transitions of patterns), the Pattern Transition Detection Algorithm (PTDA) has been developed [22, 25]. The method combines Change Point Analysis (CPA, [34]) which is applied to the empirical time series and to “second level” time series, as the DC measure, RPs, and Time Frequency Distributions (TFDs). Six change points can be identified: one each for changes of the mean, the variance, and the linear trend of the empirical time series, and one for a change of the mean of the DC, the lines of the RP, and of the frequency levels of the TFD. For this, the PTDA includes the construction of RPs and of TFDs. TFD is a method to calculate and visualize the frequency of a signal as it changes with time [35, 36]. In order to identify frequency changes, a moving window approach is implemented. Mathematically, both time t and frequency ω are variables of a distribution P(t,ω) which describes the amplitude (energy) of the signal at each given t and ω. Time and frequency are plotted on a plane (x: time, y: frequency) and color coding is used for the representation of the amplitude (energy) of the frequencies. In the RPs and TFDs, the CPA with respect to the changes of the mean is applied to every line. Then, a histogram of the change points of all lines is build, and the peak of the histogram determines the point of change for the whole matrix. The probability of a pattern transition in a given process is based on all change points which are identified in the original time series and in all “second order” measures with the density (probability) is color coded in a blue bar.
Case report
A 20-year-old soccer player with education in an Austrian football Bundesliga academy came to our sports-psychiatric outpatient clinic for treatment of major depression. During after-care treatment, the patient was able to resume sports training. He re-started even before the pre-season. His performance was initially reduced. In addition, load control by the SNS was implemented. The psychological parameters of the SPQ stabilized, but longer recovery times after athletic exertion still had to be considered for a while.
At the end of the pre-season a severe sports injury occurred. The soccer player twisted his cruciate ligament in a cup match without external influences. Even before the injury, the system dynamics in the SNS had changed significantly. The consequence was an orthopedic surgery and rehabilitation. Thus, psychotherapy sessions were adapted with topics regarding the perspective of sports.
Results
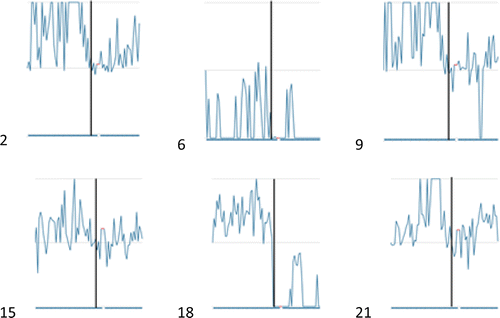
The time series length which was created by daily self-assessments is 77 measurement points, with only one missing date. This was replaced by the last valid entry. The critical event (injury) occurred at measurement point 44. In almost all items of the SPQ, some days before the injury abnormalities could be seen in the respective time series compared to the first weeks of the self-assessment (Figure 1). For example, self-esteem (2), feeling comfortable in his body (9), feeling attentive and concentrated (15), feeling robust and resilient (18), and others decreased, whereas stress in terms of creating pressure by himself (6) increased. The identification with his sports – represented by the item “Success in my sports is important for me” (21) – reveals a conspicuous profile, from a medium level increasing to very high values moving back again to a medium level just some days before the accident. The alterations which can be seen already at the level of raw data can be interpreted as early warnings. The precursors also exist at the level of the time series dynamics of the item clusters (Figure 2, left column).

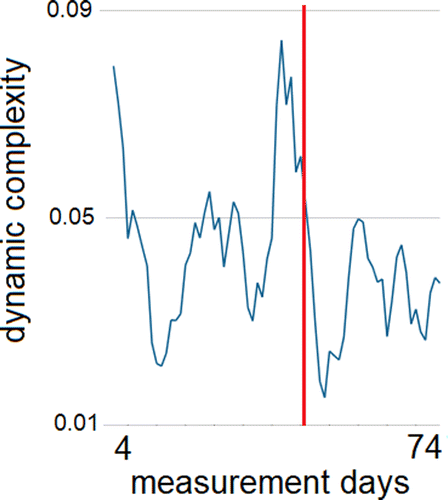
Critical instability is an important precursor of non-equilibrium phase transitions in different systems [30]. In the right column of Figure 2, the averaged complexity dynamics of the item clusters is shown. The DC was calculated by averaging the DC of the items belonging to each cluster. All item clusters except for MPC (Mental Performance Condition) indicate a complexity peak just before the accident. This feature of locally increased DC is even more evident for the total DC average of all items (Figure 3).
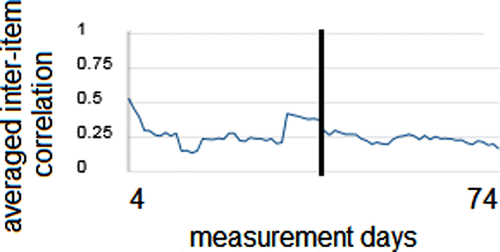
Beside critical instability, an increased synchronization of subsystems or parts of a system may be a precursor of transitions [30, 33]. Synchronization or system coherence was measured by the averaged inter-item correlation of the SPQ items in a gliding window (window width = 7 days). What we see (Figure 4) is an increased inter-item correlation from about .25 to .40 during one week before the accident, corresponding to an increasing determinism (R2) from .063 to .160.
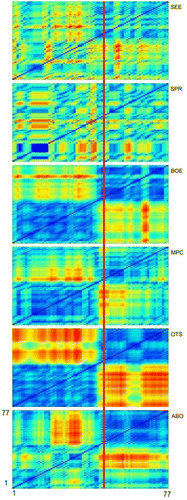
The Recurrence Plots of the item cluster dynamics (see Figure 2, left column) show pattern transitions just before the accident (Figure 5). The transition from one more or less recurrent or stable state to another can be seen by blue rectangles which are followed by another blue rectangle just before the injury occurred (red vertical line). Yellow to red colors indicate dissimilar dynamics, what means that periods of a specific dynamics before the accident are different from the dynamics after the accident (transient periods between stable periods). The only item cluster which shows no clear pattern is SPR. Instead, the SPR dynamics shows a clear-cut peak in DC as a precursor.
The application of the Pattern Transition Detection Algorithm (PTDA) to the item cluster dynamics (see Figure 2, left column) shows a pattern transition just at the day of the injury in Overtraining Symptoms (OTS) and Athlete Burnout (ABO), or some few days before in Self-esteem and Energy (SEE), Body Experience (BOE), and Mental Performance Conditions (MPC) (Figure 6). In the Stress and Pressure (SPR) dynamics two transitions were identified, one at the onset of increased stress and pressure levels (this was exactly when the training period for the season started) and a second, less distinct one at the accident which stopped experienced pressure (see item 6 in Figure 1, and item 5, not visualized) or demarcated reduced stress levels after its peak at the accident (item 7, not visualized).

Discussion
This single case study made evident that principally, precursors of sport injuries could be identified. One important precondition of short-term prediction is the availability of frequently time-sampled data series with equidistant measures. Daily Internet- or App-based self-assessments fulfill this precondition. In this case, the data were recorded by a professional soccer player during his after-care period following a hospital stay and an outpatient psychotherapy.
The study demonstrated that it is possible to produce high-frequency time series in professional sports, as it was shown by other studies in other contexts, e.g., in outpatient [37] and inpatient psychotherapy [28]. The feasibility, usability, and acceptance of Apps for data collection in real-world settings is given. Internet- and App-based data collection and data storage was realized by the Synergetic Navigation System (SNS), which provides different ways of time series analysis and options for the visualization of the results. Here we used the algorithms of Dynamic Complexity, dynamic inter-item correlations, and Recurrence Plots. The PTDA analysis was realized in Matlab [25]. The clear-cut pattern transition and the precursors of the sports injury are promising for further studies. A network modelling approach confirmed the pattern transition and will be reported in a following article.
Clinically, the athlete experienced a threatening overload by different challenges in his private and sports life, contributing to MDD and suicidality. This raised an attitude of indifference and ambiguity towards sports activities and his professional perspectives, protecting him from further increasing demands by himself and by others. In this situation, the patient had a choice and decided to retire from active sports. The psychotherapy focused on new perspectives and activities in his life, supporting the end of the career and coaching an important life transition.
Although the precursors of the life transition and the injury are mirrored by the SPQ time series and the applied analysis methods, there are some limitations of this case report.
The article reports on a single case study with data of one single athlete, which means that no conclusions can be drawn to other athletes or even to the causal relationships of the described changes in measures and the injury. Replications on bigger samples are necessary in order to prove the short-term predictability of critical events in professional sports. Another question is if athletes without prior depression or other cognitive-emotional impairments would show similar early warning patterns before injuries in their time series.
At the moment, the SPQ indeed has no psychometrical proof, e.g., by exploratory and confirmatory factor analysis. This is planned after applications to a sufficient sample size, which is work in progress. Another issue is not only the sensitivity of the measure and of the data, but also its specificity. Are the precursors like those we identified specific for sport injuries or could they also indicate other events, e.g., relapses of depression or of other diseases, suicidal crises, or even evolutionary steps in the personality development?
The conclusion of this study is that the technology for psychological process monitoring in professional sports is available and the option for identifying early-warning signals exists. The relationship between psychological parameters, like overburdening, strain and stress, but also self-esteem and the identification with a perspective in professional sports at the one hand, and the vulnerability of injuries or health crises at the other hand [38, 39], was confirmed again. Further research is necessary in order to create big data for a deeper understanding of the mechanisms in general, but also of the personal bio-psycho-social system dynamics of athletes.
References
1 . Relationships between athletic identity, coping skills, social support, and the psychological impact of injury in recreational participants. J Appl Sports Psychol. 2001;13:40–59.
2 . Injury incidence and injury patterns in professional football: the UEFA injury study. Br J Sports Med. 2011;45:553–8.
3 Time before return to play for the most common injuries in professional football: a 16-year follow-up of the UEFA Elite Club Injury Study. Br J Sports Med. 2020;54:421–6.
4 . The influence of psychological factors on sports injuries: review of the literature. Am J Sports Med. 2000;28(5 Suppl.):S10–S15.
5 . Psychosocial antecedents of sport injury: review and critique of the stress and injury model. J Appl Sports Psychol. 1998;10:5–25.
6 . Psychological predictors of injury occurrence: a prospective investigation of professional Swedish soccer players. J Sport Reha. 2013;22:19–26.
7 . The relationship of stress, competitive anxiety, mood state, and social support to athletic injury. J Athletic Training. 1996;31:296–9.
8 . Psychological dynamics in sport and exercise. Champaign, Illinois: Human Kinetics; 2008.
9 . Sport injury, psychology and intervention: an overview of empirical findings. 2006. Available from: http://www.idrottsforum.org
10 . Perceptual-cognitive expertise in sport: ameta-analysis. J Sport Exercise Psychol. 2007;29:457–78. https://doi.org/10.1123/jsep.29.4.457
11 . The unity and diversity of executive functions and their contributions to complex “frontal lobe” tasks: a latent variable analysis. Cog Psychol. 2000;41:49–100.
12 . Take the first heuristic, self-efficacy, and decision-making in sport. J Exp Psychol Appl. 2012;18:154–61. https://doi.org/10.1037/a0027807
13 . Overtraining from a sports psychiatry perspective. German J Sports Med. 2021;72:271–9. https://doi.org/10.5960/dzsm.2021.496
14 . Risk profiles for athlete burnout in adolescent elite athletes: a classification analysis. Psychol Sport Exercise. 2019;2019(41):130–41. https://doi.org/10.1016/j.psychsport.2018.11.005
15 Psychotherapy is chaotic - (not only) in a computational world. Front Psychol. 2017;8:379. https://doi.org/10.3389/fpsyg.2017.00379
16 Complex individual pathways or standard tracks? A data-based discussion on the trajectories of change in psychotherapy. Couns Psychother Res. 2020. https://doi.org/10.1002/capr.12300
17 . Monitoring player welfare: a review of the importance of systematic monitoring of Australian football players in back-to-back seasons in the northern territory to prevent overtraining syndrome, injury, illness, psychological illness, and/or athlete burnout. preparetoperform.net 2012. Available from: https://www.preparetoperform.net/uploads/4/8/6/3/48639259/monitoring_player_welfare_revd.pdf
18 .
Mathematical methods and concepts for the analysis of extreme events . In: Albeverio SJentsch VKantz HEd., (Eds.). Extreme events in nature and society. Berlin: Springer; 2006. 47–68.19 Early-warning signals for critical transitions. Nature Rev. 2009;461:53–59. https://doi.org/10.1038/nature08227
20 Methods for detecting early warnings of critical transitions in time series illustrated using simulated ecological data. PLoS One. 2012;7: e41010. https://doi.org/10.1371/journal.pone.0041010
21 Critical fluctuations as an early-warning signal for sudden gains and losses in patients receiving psychotherapy for mood disorders. Clin Psychol Sci. 2019. https://doi.org/10.1177/2167702619865969
22 Convergent validation of methods for the identification of phase transitions in time series of empirical and model systems. Front Psychol. 2020;11:1970. https://doi.org/10.3389/fpsyg.2020.01970
23 . The identification of critical fluctuations and phase transitions in short term and coarse-grained time series – a method for the real-time monitoring of human change processes. Biol Cybern. 2010;102:197–207. https://doi.org/10.1007/s00422-009-0362-1
24 . Recurrence plots for the analysis of complex systems. Phys Report. 2007;438:237–329.
25 . Detecting pattern transitions in psychological time series – A validation study on the Pattern Transition Detection Algorithm (PTDA). PloS One. 2022;17:e0265335. https://doi.org/10.1371/journal.pone.0265335
26 The Therapy Process Questionnaire. Factor analysis and psychometric properties of a multidimensional self-rating scale for high-frequency monitoring of psychotherapeutic processes. Clin Psychol Psychother. 2019;26:586–602. https://doi.org/10.1002/cpp.2384
27 . Development and preliminary validation of an athlete burnout measure. J Sport Exercise Psychol. 2001;23:281–306.
28 . Real-time monitoring of psychotherapeutic processes: concept and compliance. Front Psychol. 2016;7:604. https://doi.org/10.3389/fpsyg.2016.00604
29 . Monitoring change dynamics – a nonlinear approach to psychotherapy feedback. Chaos Compl Lett. 2018;11:355–75.
30 , Synergetik in der Psychologie: Selbstorganisation verstehen und gestalten
[Synergetics in Psychology: Understanding and Supporting Self-Organization] . Göttingen: Hogrefe; 2010.31 . Recurrence quantification analysis: theory and best practices. Berlin: Springer Series in Understanding Complex Systems; 2015.
32 . Detecting critical state before phase transition of complex biological systems by hidden Markov model. Bioinformatics. 2016;32:2143–50. https://doi.org/10.1093/bioinformatics/btw154
33 . Systemic case formulation, individualized process monitoring, and state dynamics in a case of dissociative identity disorder. Front Psychol. 2016;7:1545. https://doi.org/10.3389/fpsyg.2016.01545
34 . Optimal detection of change points with a linear computational cost. J Am Statist Ass. 2012;107:1590–8. https://doi.org/10.1080/01621459.2012.737745
35 . Time-frequency distributions – a review. Proc IEEE. 1989;77:941–81. https://doi.org/10.1109/5.30749
36 . Time-frequency feature representation using energy concentration: an overview of recent advances. Dig Signal Process. 2009;19:153–83.
37 . Personalized high frequency monitoring of a process-oriented psychotherapeutic approach to seizure disorders: Treatment utilization and participants’ feedback. Psychotherapy. 2022;59:629–40. https://doi.org/10.1037/pst0000430
38 . Setting the bar: athletes and vulnerability to mental illness. Brit J Psychiatry. 2012;200:95–6.
39 . The elite young athlete: strategies to ensure physical and emotional health. Open Access J Sports Med. 2016;7:99.


