

On the Individuality of Sleep EEG Spectra
Abstract
Research in recent years has supported the hypothesis that many properties of the electroencephalogram (EEG) are specific to an individual. In this study, the intra- and inter-individual variations of sleep EEG signals were investigated. This was carried out by analyzing the stability of the average EEG spectra individually computed for the Rechtschaffen and Kales (RK) sleep stages. Six EEG channels were used to account for the topographical aspect of the analysis. Validity of the results was supported by considering a wide dataset of 174 subjects with normal sleep. Subjects spent two consecutive nights in the sleep laboratory during which EEG recordings were obtained. High similarity between average spectra of two consecutive nights was found considering an individual. More than 89% of the second night recordings were correctly assigned to their counterparts of the first night. The average spectra of sleep EEG computed for each RK sleep stage have shown a high degree of individuality.
Electroencephalography (EEG) continues to be an important medical diagnostic instrument. In particular in sleep medicine it serves as a major source for determining sleep stages, arousals, and other important variables. Evidence is increasing that EEG signals tend to show characteristics that are tied to an individual, while diagnostic analysis of EEG data relies on invariants independent from the individual patient. Therefore, it is important to investigate the scale of individuality in EEG data and its possible effects in diagnostics. The study of the level of individuality of sleep EEG is the main aim of our research reported in this paper.
Several articles dealing with the individual characteristics of EEG have been published during the last three decades (De Gennaro, Ferrara, Vecchio, Curcio, & Bertini, 2005; De Gennaro et al., 2008; Eischen, Luckritz, & Polich, 1995; Finelli, Achermann, & Borbély, 2001; Gaillard & Blois, 1981; Silverstein & Levy, 1976; Stassen, Bomben, & Propping, 1987; Stassen, Lykken, & Bomben, 1988a; Stassen, Lykken, Propping, & Bomben, 1988b; Stroganova et al., 2009; Tinguely, Finelli, Landolt, Borbély, & Achermann, 2006; Werth, Achermann, Dijk, & Borbély, 1997).
Numerous articles have treated the question whether properties of EEG signals are inherited. The similarity of EEG signals of an individual, monozygotic and dizygotic twins was studied by Stassen et al. (1987, 1988a, 1988b). They concluded that EEG signals recorded for the same person on different occasions show the highest similarity, followed by the similarity of EEG signals of monozygotic twins. The EEG signals of dizygotic twins were found to be less similar but in comparison to unrelated persons a higher similarity was observed. Eischen et al. (1995) observed higher correlations for selected spectral power and mean frequency measures among biologically related members of the same family in comparison to nonfamily controls.
The research mentioned so far dealt with subjects being awake. During sleep many specific individual EEG properties can be found. For instance, the characteristics of the sleep spindles are often in the center of interest. It was observed that each subject has its own characteristic sleep spindles and that variations between individuals are considerable (Gaillard & Blois, 1981; Silverstein & Levy, 1976; Werth et al., 1997). Finelli et al. (2001) studied the topographical distribution of spectral power in nonrapid eye movement sleep (NREM) and they observed that for a given frequency band the individual average power distribution showed remarkable similarity for two recordings separated by 40 hr of sleep deprivation. Later, this analysis was extended by taking into account rapid eye movement (REM) and wake periods (Tinguely et al., 2006). Again, individually different power distributions were observed. All intra-individual Manhattan distances in NREM and REM were smaller than inter-individual distances, and therefore the variation due to sleep deprivation did not change the spectra of an individual in such an amount that it could be mistaken for another individual (within the group of eight subjects).
De Gennaro et al. (2005), by considering a range of EEG frequencies, four EEG electrodes and a group of ten persons spending six consecutive nights in the sleep laboratory, found that the power spectra were remarkably stable for each subject. This was observed in spite of the fact that during the second night a condition leading to deep sleep deprivation was applied. Furthermore, the interaction of the four averaged spectra resulted in a specific individual pattern. These findings were later supported by a study investigating genetically determined patterns of human sleep during NREM sleep (De Gennaro et al., 2008). In the same study the authors estimated a heritability of 96% within monozygotic twins, not influenced by sleep need and intensity.
The main goal of this paper was to take a deeper look at individual EEG characteristics in sleep. In comparison to the previous studies (i) a significantly greater database of healthy sleepers was considered, and (ii) a finer division of sleep into the standardized Rechtschaffen and Kales (R&K; Rechtschaffen & Kales, 1968) sleep stages was applied. The classification into R&K sleep stages is strongly influenced by the EEG frequency distribution and thus the average spectra of different sleep stages differ. Therefore, if a general average spectrum is calculated over all sleep stages, then this average is influenced by the time spent in each sleep stage. In the present study, the average spectrum calculated for a given R&K sleep stage was considered instead and it was investigated whether the average EEG spectra of a given sleep stage can be considered as typical for each subject.
Materials and Methods
Data Collection and Preparation
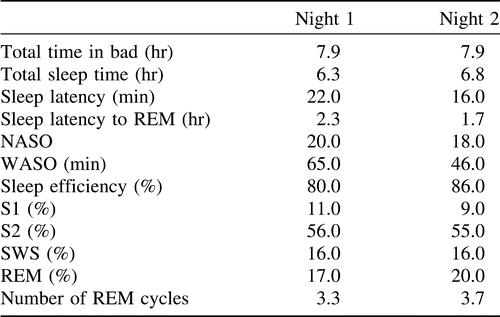
In contrast to most previous research on individual EEG characteristics, a large collection of all-night polysomnographic (PSG) recordings was used. Data of 174 subjects (81 males and 93 females), age between 20 and 95 years (M = 51 years, SD = 20 years) from the sleep database created during the EU SIESTA project (1997–2000), were used (Klösch et al., 2001). One aim of the SIESTA project was to create a normative database of healthy and sleep-disturbed patients. The project was organized as a multicenter study, which comprised eight clinical partners and eight engineering groups located in Europe. According to the SIESTA recording protocol all subjects had to document their sleep habits over 14 nights. Subjects spent two consecutive nights (7th and 8th night) in the sleep laboratory during which PSG recordings were obtained. Therefore, 348 all-night PSG recordings were used in this study. PSG recordings started at the subjects’ usual bedtime and were terminated at their usual time of getting up in the morning. Within the SIESTA project the ICD-10-based (International Statistical Classification of Diseases and Related Health Problems, 10th revised version, World Health Organization, 1992) diagnosis was used to identify subjects with sleep-related disorders including sleep apnea, nonorganic insomnia, mild to moderate generalized anxiety disorder, mood disorder, Parkinson’s disease, and periodic limb movement (Klösch et al., 2001). These patients were not used in the current study. Subjects with a history of drug abuse or habituation (including alcohol), subjects requiring psychoactive medication and/or other drugs that might interfere with the SIESTA study assessments, subjects who were unable or unwilling to comply with the protocol, and subjects working at night were not included. Finally, only subjects without significant medical disorders interfering with the aim of the SIESTA study (Klösch et al., 2001), with a Mini Mental State Examination score ≥ 25 (Folstein, Folstein, & McHugh, 1975), a Pittsburgh Sleep Quality Index global score ≤ 5 (Buysse, Reynolds, Monk, Berman, & Kupfer, 1989), a Self-Rating Anxiety Scale score < 33 (Zung, 1971), a Self-Rating Depression Scale score < 35 (Zung, 1965), and with a bedtime between 10 pm and 12 pm were considered in this study. Considering R&K scoring, the average values of selected sleep parameters and the average percentages of sleep stages are summarized in Table 1.
The PSG recording protocol specified 16 channels of biosignals: Six EEG channels with mastoid as reference (Fp1-M2, C3-M2, O1-M2, Fp2-M1, C4-M1, O2-M1), an additional EEG channel (M2-M1) for re-referencing, two electrooculogram channels, submental electromyogram and electromyogram recorded from electrodes placed at the musculus anterior tibialis of the left and right leg (electrodes were linked), electrocardiogram, and respiratory signals (airflow; movements of the chest wall and abdomen and O2 saturation of arterial blood). The data were collected at seven different sleep laboratories.
The EEG data were downsampled to 100 Hz and band-pass filtered into the range 0.45–40 Hz using a Butterworth filter of order four. Time was partitioned into nonoverlapping 3 s segments and intervals with artifacts in at least one channel, including the M2-M1 recording, were removed in an automated process. After removing the mean for each channel and segment, autoregressive AR(10) models Xt = a1Xt − 1 + a2Xt − 2 + … + a10Xt − 10 + et were fitted with the Burg method to each channel and segment. The power spectral density function of such an AR model for normalized frequencies, S2(f) = σ2/ |A(e−2πf)|2, was calculated using the characteristic polynomial A(B) = 1 − a1B − a2B2 − … − a10B10 (Akaike, 1969). 1Matlab® (ver. R2011b) routine pburg was used to follow these steps of power spectra density estimation via Burg’s method.
For nonoverlapping 30 s intervals sleep stages according to R&K were assigned using the validated automatic sleep stager Somnolyzer 24 × 7 (Anderer et al., 2005) followed by visual quality review. The identical R&K class was assigned to each 3 s segment within the 30 s. For each subject, each sleep stage (wake, S1, S2, slow-wave sleep (SWS) including S3 and S4 stages, REM) and each EEG channel, a vector averaging S2rel(f) over all 3 s segments with the same R&K label was computed (f = 1, 2, …, 30 Hz). Figure 1 shows an example of average spectra for two subjects during 2 nights. 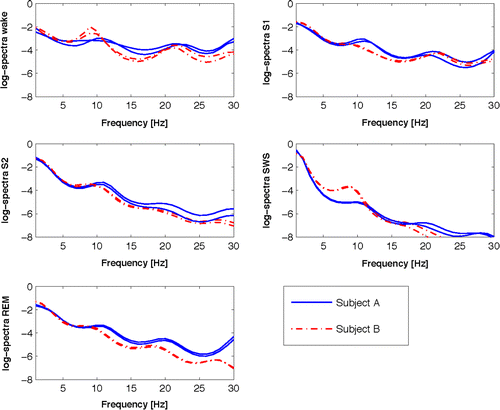
Analysis was carried out for six unipolar EEG montages (Fp1-M2, C3-M2, O1-M2, Fp2-M1, C4-M1, O2-M1), as well as for nine bipolar montages (Fp1-Fp2, C3-C4, O1-O2, Fp1-C4, Fp1-O2, C3-Fp2, C3-O2, O1-Fp2, O1-C4). Bipolar montages were obtained by digital subtraction of the linked mastoids referential channel (M2-M1).
Individuality of Average Spectra
For each sleep stage we calculated 174 distances of the intra-individual average spectra between the 2 nights of the same subject and compared the same to the distances between the first night average spectrum of each person and a randomly assigned average spectrum of the second night. This randomization was carried out by using a random permutation of the 174 recordings of the second night with no matches. To align the values of two nights’ average spectra, the following procedure was applied. The average spectra of the first night were standardized componentwise; that is, the 174 average spectra were transformed to have zero mean and unit variance for each frequency (f = 1, 2, …, 30 Hz). Using the computed means and variances of the first night, the same standardization procedure was applied for the average spectra of the second night. The Euclidean distance was used as a metric for average spectra distance computation.
Next, the task of finding the corresponding second night average spectrum considering a given subject and its first night average spectrum was investigated. This was carried out for each R&K sleep stage separately, either channel by channel or using all channels at once. A random assignment using a permutation of all n subjects has an expected number 1 of correct assignments, irrespective of n. This follows from the fact that each subject gets its correct counterpart with a probability of 1/n. Two procedures were employed. The first one assigns to each subject of the first night the nearest neighbor of the second night using the Euclidian distance. This means that two or more recordings of the first night can share the same nearest neighbor from the second night. Therefore a second approach allowing strict one-to-one mapping was also employed. This was done by the iterative procedure where the average spectra pair with the lowest Euclidian distance between two nights was assigned in each step and removed afterwards. This was repeated until all pairs were assigned or, in other words, until all subjects of the first night have received a subject of the second night.
Results
Considering the S2 sleep stage, Figure 2 shows the boxplots of intra- and inter-individual distances for the unipolar C3-M2 and the bipolar C3-C4 EEG montages. 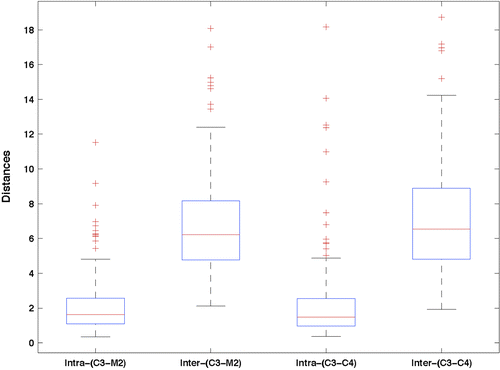
The average intra- and inter-individual distances were 2.15 and 6.83 for C3-M2 and 2.32 and 7.04 for C3-C4, respectively. A two-sample t-test showed a significant difference between the means. The results for all 15 unipolar and bipolar EEG channels and 5 R&K sleep stages are summarized in Table 2. For all sleep stages and all channels the means of inter-individual distances were significantly larger (p < .001). In the case of SWS, nine of the subjects had to be excluded, as they did not reach SWS in at least one of the 2 nights.
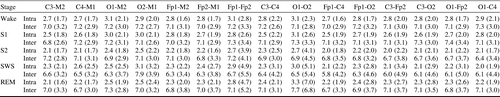
Table 2 also shows that the smallest intra-individual distances were observed for S2 and REM and the largest during the wake stage and S1. Inter-individual distances were smaller for SWS and larger for the remaining stages.
Selecting the first night average spectra of each subject and assigning its nearest neighbor of the second night can specify the percentage of correct matches. Considering each EEG channel and each sleep stage separately the percentage of these matches is summarized in Table 3. 2Again, in the case of SWS this was based on 165 subjects who reached SWS during both nights.
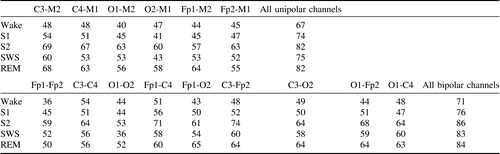
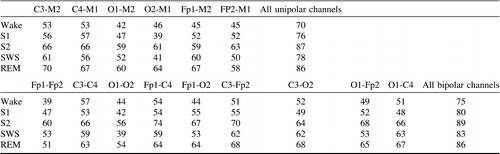
The procedure of matching the nearest neighbor of the second night may result in more than one match. By using a one-to-one mapping constraint, better results in comparison to Table 3 were achieved – Table 4. For example, using all channels, 89% of correct matches for S2 can be observed for the bipolar montage and 87% for the unipolar montage. These percentages represent 155 and 152 correct assignments, respectively. Considering a single electrode, similar to the results of Table 3, C3-M2 provides the highest average value (equal to 61.2%) obtained by averaging percentages of correct assignments over all R&K stages.
The age effect on the average spectra was also investigated. Figure 3 shows the relative deviations of the spectra means for the three age groups (20–39), (40–59), and (60+) (young, middle-age, and elderly groups) to the general mean computed by considering average spectra of all subjects. While in the case of S1 and REM sleep and the delta frequency range (1–5 Hz) the power spectrum of the elderly people seems to be substantially lower in comparison to young subjects, there seems to be a flip at around 2.5 Hz in the case of S2 and SWS leading to the increase of the spectral power in the elderly group. S2 spectra of elderly people were on average lower in the spindle frequency range of 12–15 Hz. The deviations for the young and elderly groups were observed to be nearly symmetrical to the frequency axis. Interesting opposite deviations for α frequency range at about 10 Hz can be observed between elderly and young groups for the wake stage. Note that during the wake stage the subjects are expected to have eyes closed, because our sleep recording starts after all lights are turned off. For frequencies greater than 15 Hz no significant deviations are observed between groups. Spectral power in this higher frequencies range is expected to be low because our procedure of artifact removal and averaging eliminates random noise fluctuations. 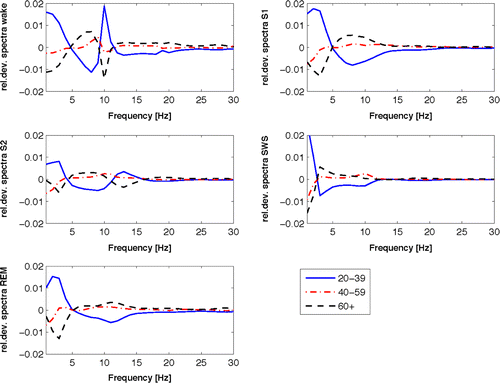
Discussion
The objective of the present work was to demonstrate on a wide collection of subjects that average spectra of sleep EEG signals show a high degree of stability and individuality during two consecutive night recordings. In contrast to previous studies this was investigated for each R&K stage separately.
First, intra-individual distances were observed to be significantly lower than inter-individual distances for each sleep stage and each of the 15 EEG channel montages. De Gennaro et al. (2005) also observed similarly strong differences between inter- and intra-individual EEG changes during NREM sleep, suggesting a specific EEG spectra stability within each individual.
Secondly, by assigning average spectra of the second night to the corresponding subject of the first night a high level of correct matches was observed. When considering all EEG channels and using the one-to-one mapping scheme (Table 4), the percentage of correct assignment varied within 75–89% for the bipolar EEG montage and within 70–87% for the unipolar montage. These are high numbers realizing that 89% means that for 155 subjects one can correctly find the other night average spectra within a pool of the spectra averages of 174 subjects. When considering individual electrodes the highest level of correct assignments was observed for S2 and REM stages and for the unipolar and bipolar montages that includes the C3 or C4 channel. The unipolar C3-M2 montage seems to lead to the most consistent performance considering all R&K stages. When considering all channels, the probability of correct identification increased for both the unipolar and bipolar montages. The bipolar montage provided slightly better results in comparison to the unipolar montage.
Finally, it was observed that the age factor has a decisive influence on the relative frequency distribution. Therefore, the average spectrum cannot be considered as constant over an individual’s life span. However, this significant influence of age, given a sleep stage, should not be confused with other findings in the literature showing, for example, that the total amount of REM, its percentage, or percentage of SWS decreases with age (Floyd, Janisse, Jenuwine, & Ager, 2007; Klerman & Dijk, 2008; Ohayon, Carskadon, Guilleminault, & Vitiello, 2004). Instead, the present study shows that the spectral structure of REM sleep, S2, or SWS sleep stages, as defined by the R&K rules, changes with increasing age.
In conclusion, individual differences in sleep need to be considered when defining different physiological categories of sleep; for example, categories of good subjective or objective sleep quality profiles.
References
(1969). Power spectrum estimation through autoregressive model fitting. Annals of the Institute of Statistical Mathematics, 21, 407–419.
(2005). An E-health solution for automatic sleep classification according to Rechtschaffen and Kales: Validation study of the Somnolyzer 24 × 7 utilizing the Siesta database. Neuropsychobiology, 51, 115–133.
(1989). The Pittsburgh sleep quality index: A new instrument for psychiatric practice and research. Psychiatry Research, 28, 193–213.
(1995). Spectral analysis of EEG from families. Biological Psychology, 41, 61–68.
(2001). Individual ‘fingerprints’ in human sleep EEG topography. Neuropsychopharmacology, 25, S57–62.
(2007). Changes in REM-sleep percentage over the adult lifespan. Sleep, 30, 829–836.
(1975). “Mini mental state”: A practical method for grading the cognitive state of patients for the clinician. Journal of Psychiatric Research, 12, 189–198.
(1981). Spindle density in sleep of normal subjects. Sleep, 4, 385–391.
(2005). An electroencephalographic fingerprint of human sleep. Neuroimage, 26, 114–122.
(2008). The electroencephalographic fingerprint of sleep is genetically determined: A twin study. Annals of Neurology, 64, 455–460.
(1981). Autoregressive estimation of short segment spectra for computerized EEG analysis. IEEE Transactions on Biomedical Engineering, 28, 630–638.
(2008). Age-related reduction in the maximal capacity for sleep-implications for insomnia. Current Biology, 18, 1118–1123.
(2001). The SIESTA project polygraphic and clinical database. IEEE Engineering in Medicine and Biology Magazine, 20, 51–57.
(2004). Meta-analysis of quantitative sleep parameters from childhood to old age in healthy individuals: Developing normative sleep values across the human lifespan. Sleep, 27, 1255–1273.
(1968). A manual of standardized terminology, techniques and scoring system for sleep stages of human subject. Bethesda, MD: US Departmant of Health, Education, and Welfare.
(1976). The stability of the sigma sleep spindle. Electroencephalography and Clinical Neurophysiology, 40, 666–670.
(1987). Genetic aspects of the EEG: An investigation into the within-pair similarity of monozygotic and dizygotic twins with a new method of analysis. Electroencephalography and Clinical Neurophysiology, 66, 489–501.
(1988a). The within-pair EEG similarity of twins reared apart. European Archives of Psychiatry and Neurological Sciences, 237, 244–252.
(1988b). Genetic determination of the human EEG Survey of recent results on twins reared together and apart. Human Genetics, 80, 165–176.
(2009). The nature of individual differences in EEG parameters during homogeneous visual field in 5- and 6-year-old twins: A pilot study. Clinical Neurophysiology, 120, 1492–1500.
(2006). Functional EEG topography in sleep and waking: State-dependent and state-independent features. Neuroimage, 32, 283–292.
(1997). Spindle frequency activity in the sleep EEG: Individual differences and topographic distribution. Electroencephalography and Clinical Neurophysiology, 103, 535–542.
(1965). A self-rating depression scale. Archives of General Psychiatry, 12, 63–70.
(1971). A rating instrument for anxiety disorders. Psychosomatics, 12, 371–379.
We would like to thank Peter Anderer, Paul L. Nunez, and Leonard J. Trejo for their helpful comments and suggestions on this work. The presented work was supported by the Austrian Science Fund FWF (Fonds zur Förderung der wissenschaftlichen Forschung) through Project No. P19857 “Multi-sensor sleep modeling based on contextual data fusion” and by the Slovak Research and Development Agency under the Contract No. APVV-0096-10.