The Meta-Plot
A Graphical Tool for Interpreting the Results of a Meta-Analysis
Abstract
Abstract. The meta-plot is a descriptive visual tool for meta-analysis that provides information on the primary studies in the meta-analysis and the results of the meta-analysis. More precisely, the meta-plot portrays (1) the precision and statistical power of the primary studies in the meta-analysis, (2) the estimate and confidence interval of a random-effects meta-analysis, (3) the results of a cumulative random-effects meta-analysis yielding a robustness check of the meta-analytic effect size with respect to primary studies’ precision, and (4) evidence of publication bias. After explaining the underlying logic and theory, the meta-plot is applied to two cherry-picked meta-analyses that appear to be biased and to 10 randomly selected meta-analyses from the psychological literature. We recommend accompanying any meta-analysis of common effect size measures with the meta-plot.
Meta-analysis is an important tool for researchers to gain an overview of the literature within a specific area, particularly as the numbers of journals and articles have grown exponentially over the years. Meta-analyses statistically combine the results from similar studies and yield estimates of average effect size, between-study variance in true effect size (i.e., heterogeneity in true effect size), and moderators of the effect size (Borenstein et al., 2009).
The quality of the output of a meta-analysis is largely determined by the accuracy and precision of its estimates. The accuracy of a meta-analysis is the difference between the estimated average effect size and the true effect size. The bigger this difference, the less accurate and the more biased the average effect size estimate will be. The precision of the average effect size estimate is inversely related to its uncertainty or SE.
There are many factors that influence the accuracy (bias) and precision of the meta-analytic average effect size estimate. For example, an increase in the number of primary studies generally positively affects the precision of the meta-analytic effect size estimate, while each primary study’s number of observations also positively affects the estimate’s precision. Another important factor that affects the accuracy and precision of a meta-analysis is publication bias: the selective publication of studies with a favorable, usually statistically significant, outcome. In case of publication bias, meta-analytic average effect sizes will be overestimated (i.e., the accuracy of the effect size estimator decreases). This problem is aggravated for smaller study sample sizes (Nuijten et al., 2015). Importantly, the bias of the average effect size estimate is not ameliorated by including a large number of studies in a meta-analysis; the accuracy of the average effect size estimate of one large study is higher than of a meta-analysis based on say 1,000 smaller primary studies (Nuijten et al., 2015).
Study-level p-hacking, questionable research practices aimed at achieving statistically significant p-values (John et al., 2012), may also adversely affect the average effect size estimates of meta-analyses, but its effects are complicated (Van Aert et al., 2016). The interpretation of the output of meta-analyses becomes even more difficult because fields may differ in publication bias and p-hacking, as fields also differ in their distribution of effect sizes and sample sizes (Open Science Collaboration, 2015).
Because publication bias can seriously affect a meta-analysis’ accuracy, it is important to check whether there is evidence for publication bias in a meta-analysis. However, current methods to detect publication bias in meta-analysis often lack statistical power (Begg & Mazumdar, 1994; Sterne et al, 2000). Furthermore, existing methods to correct for publication bias often depend on strong assumptions, and effect size estimates between these correction methods can vary substantially for the same meta-analysis (Carter et al., 2019; McShane et al., 2016; Van Aert et al, 2019). The new method we present here enables the examination of whether extreme publication bias in combination with a true zero effect size can alternatively explain the meta-analytic effect size, without making strong assumptions and not statistically testing for publication bias.
In this paper, we present the meta-plot, a general and descriptive graphical tool for meta-analysis. Meta-plot provides information on most of the aforementioned aspects of a meta-analysis. Specifically, the meta-plot portrays (1) the precision and statistical power of the primary studies in the meta-analysis, (2) the average effect size estimate and confidence interval of a random-effects meta-analysis, (3) the results of a cumulative random-effects meta-analysis yielding a robustness check of the meta-analytic average effect size with respect to primary studies’ precision, and (4) evidence of publication bias. We recommend using the meta-plot in addition to any meta-analysis.
In the supplement, we compare the meta-plot to existing methods to detect and correct for publication bias. Below we outline two cherry-picked examples of meta-analyses, including their funnel plots as well as the results of some publication bias methods. In the subsequent section, we use these two examples to explain the meta-plot and its characteristics. In the supplement, we apply and interpret the meta-plot to 10 meta-analyses randomly selected from the psychological literature to illustrate how the meta-plot aids the interpretation of a meta-analysis. Finally, we also illustrate a user-friendly web-application of the meta-plot. All the code to run the plots in this paper can be found in the Open Science Framework (OSF) at https://osf.io/eayfr/.
Illustrating the Meta-Plot With Two Cherry-Picked Example Meta-Analyses
To illustrate the meta-plot (see Figure 1), we cherry-picked two meta-analyses that show signs of publication bias and overestimated effects. The first example meta-analysis of McCall and Carriger (1993) focuses on infant habituation and memory performance as predictors of later IQ, as assessed with the Pearson correlation coefficient. Twelve studies are included in this meta-analysis, with each study contributing one effect size to the analysis. Eleven of the effect sizes were statistically significant based on a two-tailed test with α = .05, and sample sizes of the primary studies varied from 11 to 96 (mean = 37.25, SD = 29.05). A random-effects meta-analysis was conducted on the Fisher-z transformed correlations, using the Paule-Mandel estimator (Paule & Mandel, 1982) for the between-study variance in true effect size. The meta-analysis yielded a correlation estimate equal to r = .390, p < .001, 95% CI [.306; .469]. No evidence of heterogeneity was obtained ( = 0, Q(11) = 6.74, p = .820; I2 = 0, 95% CI [0; 38.76]).
The left column of Figure 1 shows the funnel plot (top) and contour-enhanced funnel plot (bottom) of the meta-analysis. These plots suggest a small-study effect as the primary study effect size seems to be negatively associated to sample size (Egger’s test z = 2.241, p = .025). P-uniform (Van Aert et al., 2016; Van Assen et al., 2015), a method to test and correct for publication bias, indicates that publication bias (at least partly) causes the small-study effect (L = 2.615, p = .005) in the meta-analysis of McCall and Carriger.
Adjusting for publication bias, p-uniform’s estimate equaled r = .177 (p = .119, 95% CI [−.233; .340]), whereas the estimate of the selection model approach by Vevea and Hedges (1995) to correct for publication bias was r = .263 (p < .001, 95% CI [.224; .301],  = 0). To conclude, both the funnel plots, publication bias tests, and publication bias correction methods suggest that the meta-analysis overestimates the true effect size because of publication bias; the evidence in favor of an association between infant inhabitation and later IQ is substantially smaller than suggested by the random-effects meta-analysis.
The second example meta-analysis of Rabelo et al. (2015) studies the relation between the sensation of weight and moral judgement of importance. This meta-analysis contains 25 effect sizes, transformed to standardized mean difference Hedges’ g, with 23 being statistically significant if tested two-sided with α = .05, and all of them being statistically significant if tested one-sided. The average sample size is 61.12 (SD = 20.22, N ranging from 30 to 100). The random-effects meta-analysis resulted in a statistically significant medium effect size estimate of g = 0.571, p < .001, 95% CI [0.468: 0.673], and  = 0 (Q(24) = 4.6, p = .999,993; I2 = 0, 95% CI [0, 0]), signaling extreme homogeneity, which is a sign of publication bias (Augusteijn et al., 2019). Data and code of Rabelo and colleages can be found in the OSF at https://osf.io/cgmdi/.
The funnel plot and contour-enhanced funnel plots are shown in the right column of Figure 1. It suggests small-study effects, although Egger’s test was not statistically significant (z = 1.629, p = .103). P-uniform signaled publication bias (L = 4.8, p < .001), and yields a statistically non-significant estimate of the effect size of g = −0.149, p = .789, 95% CI [−0.628; 0.186]. The estimate of the effect size by the selection model approach was 0.254 (p < .001, 95% CI [0.220; 0.289] with  = 0. To conclude, although random-effects meta-analysis suggested a medium effect size, further analyses provided strong indications of publication bias and weaker evidence of a nonzero association between the sensation of weight and moral judgement of importance. Figure 2 shows the meta-plot (first row) and summary meta-plot (second row) for both examples. These meta-plots, and their comparison to the funnel plots, are explained in the next section.
The Meta-Plot
The meta-plot contains four different pieces of information: the (1) precision and statistical power of research summarized in the meta-analysis, (2) the estimate and confidence interval of a random-effects meta-analysis, (3) the robustness of the effect size estimate with respect to primary studies’ precision (cumulative meta-analysis), and (4) evidence of publication bias. We discuss each of these in turn, by first discussing the underlying theory, followed by an explanation of each element in the meta-plot and its application to the two examples introduced in the previous section. For illustration and better understanding, Figure 3 shows a summary meta-plot of McCall and Carriger (1993) with a brief explanation of four aforementioned elements.
Precision of Research
The precision of an effect size estimate is here defined as the reciprocal of its SE,1 and is directly and positively related to the sample size on which the estimate is based. If (and only if) the true effect size differs from zero, precision is also directly and positively related to the statistical power of the study.2 Large sample size and sufficient statistical power are generally considered as signs of high quality in an empirical study (Aberson, 2011; Ellis, 2010). Illustrating the importance ascribed to the statistical power of a study, the American Psychological Association has recommended doing a power analysis preceding empirical studies (Wilkinson, 1999). In a similar vein, we believe it is important that a descriptive meta-analytic tool provides summary information on the precision of individual studies and their statistical power. The meta-plot does just that by showing at the top the percentage of primary studies having at least 80% statistical power to detect a small (S; Cohen’s d: d = 0.2, Pearson correlation coefficient: ρ = 0.1), medium (M; d = 0.5, ρ = 0.3), and large (L; d = 0.8, ρ = 0.5) effect. Although these effect sizes and their labels, formulated by Cohen (1988) are rather arbitrary, they are well-known and often used. In case another true effect size value is meaningful to the researcher, or a certain precision or sample size, the researcher is recommended to focus on the estimated effect size based on the primary studies having at least that precision rather than on those (“small,” “medium,” “large” effect size) in the meta-plot.
Next to being less precise, small studies are generally also associated with larger overestimation of effect sizes in the presence of publication bias (Bakker et al, 2012; Nuijten et al., 2015), and hence relatively many false positives get published where the true effect size is zero (Van Assen et al., 2015) Consequently, in a research field where small studies are ubiquitous and publication bias is present, a zero true effect size may still yield a statistically significant, medium or even large effect size estimate in a meta-analysis.
Although we believe that the precision of the research summarized by the meta-analysis is informative as such, we argue against dismissing the results of a meta-analysis based on small studies per se. First, if the true effect size is (very) large in a field, small studies can have sufficient statistical power and result in little overestimation, even in the presence of publication bias (Nuijten et al., 2015). Second, even when the true effect size is zero or small, small studies are not at all problematic in a field with no publication bias and no questionable research practices, as these studies do not yield biased estimates of the effect (but only less precise estimates). One could even argue that in such an unbiased field, multiple small studies are preferable to a few large studies (keeping constant sample size across studies), as the multiple small studies provide more evidence on heterogeneity and moderator effects.
Currently, however, publication bias and questionable research practices seem to affect many fields of research (Fanelli, 2010; Fanelli et al., 2017; Ferguson & Brannick, 2012; Levine et al., 2009). Moreover, in many research areas, researchers cannot be certain they are examining a (very) large true effect size. Consequently, interpreting the results of a meta-analysis incorporating many small studies, particularly if they have p-values just below .05, is tricky. These p-values just below .05 may be a signal of a true nonzero effect, or just the result of a combination of a true zero effect and publication bias, questionable research practices, and “(bad) luck”. The fourth element of the meta-plot, which will be explained later, will help distinguish between results arising from non-zero true effects and those arising from zero true effects in a field with publication bias.
Turning to the meta-plot, the top of the plot shows the statistical power of the primary studies in the meta-analysis, using four percentages. The first percentage to the left gives the percentage of primary studies in the meta-analysis that do not have sufficient statistical power to detect a large population effect. “Sufficient statistical power” is operationalized as 80% power as proposed by Cohen (1988), using a two-tailed test with α = .05 and assuming a between-subjects design. The other three percentages and top arrows (pointing to the right) refer to the percentage of primary studies succeeding to have sufficient power to detect a large (L), medium (M), and small effect (S), respectively. Note that the first two out of four percentages always add up to 100%. The vertical lines in the plot correspond to the sample sizes needed for sufficient power, for either studies on correlations (29, 84, 782) or studies comparing the means of two independent populations using a balanced design with equal group sizes (52, 128, 784). More detailed information on studies’ precision can be obtained from primary studies’ position on the x-axis, which is directly related to the study’s sample size (see Appendix A1 for calculating a study’s precision and position on the x-axis).
It is important to note that the x-axis of the meta-plot is the same across applications, meaning that it is not affected by the precision of the primary studies summarized in the meta-analysis. This facilitates comparing different meta-analyses and their meta-plots. The use of a standard format in the meta-plot also helps eliminate the subjectivity that is characteristic of the funnel plot (Tang & Liu, 2000). The maximum precision value of 1 on the x-axis in the meta-plot always translates to a sample size that equals 1,300. This is close to the sample size needed to have a statistical power of 95% to detect a small true effect size; for correlations and comparing two population means 1,293 and 1,302 observations are needed, respectively. The x-axis is approximately linear in precision, meaning that it is on a square root scale of sample size. Consequently, the x-axis approximates a ratio scale of primary studies’ precision.3
Turning to the meta-plots of the two examples shown in the first row of Figure 2, it is clear that the primary studies’ precision in both meta-analyses is low. These meta-analyses contained many small studies with insufficient statistical power to detect a true large effect size (40% of the studies in Rabelo et al., 2015, and 67% of the studies in McCall & Carriger, 1993), and many studies with sufficient statistical power to detect a large but not a medium true effect size (60% in Rabelo et al. and 33% in McCall and Carriger). Whereas the meta-analyses did not contain any large studies with sufficient statistical power to detect a small true effect size, McCall and Carriger contained two studies (17%) with (barely) sufficient statistical power to detect a medium true effect size. Finally, note that the funnel plot (first row of Figure 1) does not contain any information on statistical power of individual studies to detect a certain true effect size.
Random-Effects Meta-Analysis Effect Size Estimate and Its Confidence Interval
In line with the usual desire of researchers to generalize the results of a meta-analysis to studies that were not included (Aguinis et al., 2010; Hunter & Schmidt, 2000), we chose to calculate and depict the random-effects meta-analysis effect size estimate and its 95% confidence interval (CI 95) in the meta-plot by default. The random-effects model implies that the researcher assumes that the true effect sizes incorporated in the meta-analysis are a (random) sample of a larger normally distributed population of effect sizes and wishes to generalize his/her inferences to that population. It enables estimating the between-study variance in the true effect size. Many methods for estimating this between-study variance exist. We implemented the Paule-Mandel estimator as it generally shows the best statistical properties (Langan et al., 2016; Veroniki et al., 2016) and has attractive theoretical properties (van Aert & Jackson, 2018). For our estimation we used the R package metaphor (Viechtbauer, 2010). Although the random-effects model is often recommended as the default choice, it must be noted that the fixed-effect model is to be preferred if inference is limited to the studies in the meta-analyses, even if effect size seems heterogeneous (Hedges & Vevea, 1998; Rice et al., 2018). The user of meta-plot can also choose to depict the results of fixed meta-analysis.
In the meta-plot, the random-effects meta-analysis effect size estimate is represented by the dotted horizontal line. For convenience and ease of interpretation, each effect size’s direction is reversed in case the meta-analysis effect size estimate is negative.
The estimate and its CI 95 are also shown by the leftmost vertical line in the plot, where the estimate is represented by the black dot that naturally lies on the horizontal dotted line. As the meta-plot always shows the value 0 on the y-axis representing the effect size, the hypothesis of a zero true effect size is tested (two-tailed) by checking if the CI 95 contains the value 0.
The meta-plots for the two examples in the first row of Figure 2 show that both effect size estimates (approximately r = .39 for McCall & Carriger, 1993, and g = 0.571 for Rabelo et al., 2015) are above zero, and highly statistically significant (i.e., very small p-values) as the value 0 lies outside their confidence intervals. Note that the funnel plots in Figure 1 also show the effect size estimate of a random-effects meta-analysis, but generally does not show its precision or 95% confidence interval.
Robustness of Effect Size Estimate With Respect to Primary Studies’ Precision (Cumulative Meta-Analysis)
The third element depicted by the meta-plot is the result of all meta-analyses based on studies with a certain precision or larger. That is, each black dot at a certain x-value represents the effect size estimate of a random-effects meta-analysis based on all primary studies with precision x or larger.4 Thus, a black dot represents the results of a meta-analysis, and not of a single primary study. The CI 95 of each estimate is also presented by a vertical line. The results of the meta-analysis of very precise studies (x > 1) are presented at the complete right of the plot (x = 1).
The collection of black dots are the result of a cumulative meta-analysis with respect to precision. Others have already suggested using a cumulative meta-analysis for assessing whether a negative relationship exists between precision and observed effect size; a small-study effect (Atakpo & Vassar, 2016; Borenstein et al., 2009; Leimu & Koricheva, 2004). We implemented this suggestion in the meta-plot.
The meta-plot makes small-study effects visible: if it is the case that large effect sizes are associated with smaller studies, the black dots in the meta-plot would generally decrease from left to right. Small-study effects may also be visible from a funnel plot by funnel plot asymmetry, but it is often difficult to visually identify this asymmetry in a funnel plot (Terrin et al., 2005). Small-study effects are easier to identify in the meta-plot as the estimates are more precise (less variable) than those in the funnel plot and are also related to each other as opposed to those in the funnel plot. More specifically, dots in the funnel plot are based on effect sizes of primary studies, whereas the dots in the meta-plot are based on the results of a cumulative meta-analysis. That is, the leftmost black dot is a meta-analysis based on all studies, the black dot to the right of the leftmost one is the meta-analysis based on all studies except for the one with the lowest precision, etc. As estimates are not only more precise, but also use overlapping information, a possible trend is generally clearer from a meta-plot than from a funnel plot. Note, however, that by presenting the results of cumulative meta-analyses the meta-plot makes the inspection of individual primary effect sizes more difficult compared to the funnel plot.
We should add a cautionary note when using the meta-plot to conclude evidence of a small-study effect. For instance, consider a meta-analysis consisting of 10 primary study effect sizes differing in precision, with equal effect size estimates for the nine least precise studies and a lower effect size estimate of the most precise study. In that case, the cumulative meta-analysis will show a downward trend suggesting strong evidence of a small-study effect. Although a small-study effect arguably exists in this particular example, evidence in favor of it is weak at best since the lower effect size estimate of the most precise study may also be the result of sampling error. We therefore recommend caution concluding a small-study effect based on the meta-plot alone.
Turning to the meta-plots in the first row of Figure 2, we clearly see a decreasing trend in the black dots pointing out small-study effects in both meta-analyses. The funnel plots and contour-enhanced funnel plots also clearly show an association between primary study’s precision and their effect size, although variability of estimates is much higher than in the meta-plot. Partly, the association is so clearly visible in these funnel plots because we (cherry-)picked the meta-analyses for their strong evidence of small-study effects.
The results of the cumulative meta-analysis in the meta-plot also provide other useful perspectives for interpretation that are not provided by the funnel plot. As overestimation of average effect size in a meta-analysis is most prevalent if the included primary studies have small sample sizes, researchers have suggested to exclude such small and possibly biased studies from a meta-analysis (Button et al., 2013; Ioannidis, 2008; Kraemer et al., 1998; Nuijten et al., 2015). Stanley et al. (2010) proposed to discard the 90% least precise observed effect sizes in a meta-analysis and interpret the mean of only the 10% most precise effect sizes as meta-analytic effect size estimate. As methods such as this proposed estimator can be less biased in case of publication bias, they are recommendable as sensitivity analyses when conducting a meta-analysis.
Turning to the meta-plots of the example meta-analyses (first row of Figure 2), we see that for both examples the meta-analytic estimates based on approximately the 10% most precise studies as well as the estimate of only the largest study (rightmost dot with CI 95) are statistically significantly different from zero. However, as is clear from the x-axis of the meta-plots, neither meta-analysis includes a large study (i.e., the study with the largest sample size is 96 for McCall & Carriger, 1993, and 100 for Rabelo et al., 2015), which implies that even the estimate of the largest study may have considerable bias in case of publication bias combined with a zero or small true effect size. This dependence on the precision of the largest included studies, where the largest studies may still be small and result in overestimation of effect size, can therefore be considered a limitation of relying on a meta-analysis based on only the 10% most precise studies.5
As such, we advise to also consider the estimates of meta-analyses based on primary studies with sufficient statistical power given a small, medium, and large true effect size. These are shown in the summary meta-plots in the second row of Figure 2. Next to the estimate and CI 95 of the meta-analyses including all studies (leftmost), it shows these results for studies with sufficient power (80%) to detect a large true effect size (left vertical line), medium true effect size (middle), and small true effect size (right). Note that the summary meta-plot is just the meta-plot with (often many) dots left out, keeping only the leftmost dot and those immediately to the right of the vertical lines. As such the summary meta-plot is more transparent than the meta-plot if the meta-analysis is conducted on many studies. Additionally, small-study effects will also be visible from the summary meta-plot. We therefore recommend reporting the summary meta-plot in meta-analyses including many studies.
The summary meta-plots of the examples indeed also suggest small-study effects. The plot of McCall and Carriger (1993) only shows the results of three meta-analyses, as no studies were conducted with sufficient statistical power to detect a small effect. Similarly, the summary meta-plot of Rabelo et al. (2015) only shows the results of two cumulative meta-analyses, as it does not contain studies with sufficient statistical power to detect a medium effect.
Evidence of Publication Bias
The last and fourth optional element enables examining potential publication bias. That is, whether a statistically significant meta-analytic effect size can be explained by publication bias alone. The meta-plot presents the expected effect sizes of the cumulative meta-analysis based on a zero true effect in combination with extreme publication bias (i.e., if only statistically significant results get included in the meta-analysis) using black stars. Although a zero true effect size is a very minimal threshold, we selected the zero true effect size reference point as null-hypothesis significance testing is still the main statistical framework in the social sciences. The expected effect sizes based on a zero true effect size combined with extreme publication bias necessarily decrease with studies’ increasing precision, as overestimation by publication bias decreases with increased precision. As such, the expected effect sizes also depict small-study effects. See Appendix A2 for the technical details on how the results corresponding to the black stars are calculated.
The value of the expected results in assessing publication bias lies in its comparison with the results of the cumulative meta-analysis based on the precision of the primary studies (the black dots). In case of a nonzero true effect size, the black dots are expected to lie above the black stars and a zero true effect size in combination with extreme publication bias cannot explain the results, and the true effect size may exceed zero. If the black dots are not above the black stars, an alternative explanation of the effect in the meta-analysis is extreme publication bias in combination with a zero true effect size, and we recommend not to interpret the statistically significant meta-analytic effect size estimate as evidence of a nonzero true effect size.6 Note that this method of detecting publication bias only makes sense if most primary studies are statistically significant; after all, if a meta-analysis includes a substantial proportion of non-significant studies, this is already evidence in itself that publication bias is not extreme. Therefore, this element of the meta-plot is only shown if at least 80% of the primary effect sizes are statistically significant.7
We applied our method to assess publication bias on both the meta-plots of McCall and Carriger (1993) and Rabelo et al. (2015), because they both contain more than 80% statistically significant primary effect sizes (12 of 13 vs. 23 of 25). As the black dots of McCall and Carriger lie above the black stars that are expected from extreme publication bias, publication bias cannot entirely explain the observed effects suggesting a nonzero true effect size may exist. In the meta-plot of Rabelo et al. on the other hand, the black dots almost coincide with the black stars, showing that the results of the meta-analysis can be entirely explained by a zero true effect size in combination with extreme publication bias. Note that these results for both meta-analyses are also in line with the majority of the results of the publication bias methods reported earlier. Finally, while the funnel plot only provides evidence of small-study effects and not publication bias, the contour-enhanced funnel plots in Figure 1 helps to distinguish publication bias as a cause of small-study effects. Both contour-enhanced funnel plots indeed provide evidence of publication bias, as most primary study effect sizes appear “just statistically significant.” However, as opposed to the meta-plot, the contour-enhanced funnel plot cannot tell if the meta-analytic results can or cannot be alternatively explained by a zero true effect size in combination with extreme publication bias.
Software for Creating a Meta-Plot
Meta-plots can currently be created for three effect size measures: standardized mean difference based on two independent groups (Hedges g), Pearson correlation coefficient, and odds ratio (see Appendix A). The function “meta_plot()” in the R package “puniform” (van Aert, 2020) can be used for creating a meta-plot. The function’s input concerning primary studies depends on the effect size measure. In case of standardized mean differences, the user has to specify means, SDs, and sample sizes for both groups. For correlation coefficients sample size and sample correlation coefficient are needed. For odds ratios the cell frequencies of a 2 × 2 frequency table are required. By default a meta-plot is drawn based on all effect sizes in a meta-analysis, but a summary meta-plot can be created by specifying the argument “nr_lines = ‘summary’” in the “meta_plot()” function.
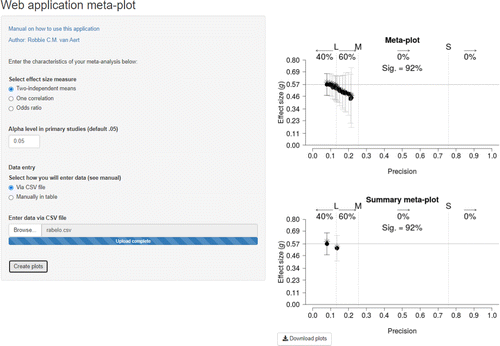
We also developed a user-friendly web application (https://rvanaert.shinyapps.io/meta-plot/) to create meta-plots for researchers who are not familiar with R. Figure 4 shows a screenshot of this web application. The same information as in the “meta_plot()” function has to be specified, but using a web browser and a graphical user interface. Data can be entered in a table, or uploaded via a comma separated file that follows a specific format as explained in the manual of the web application. If the data are loaded in the web application, the meta-plot and summary meta-plot are created by clicking the button (“Create plots”), and these plots can also be downloaded as a pdf file (“Download plots” button).
Discussion
This paper presents, explains and illustrates meta-plot, a user-friendly graphical tool for meta-analysis. The goal of the meta-plot is to assist in the interpretation of meta-analytic results in the context of the field and the primary studies’ effect sizes on which the meta-analysis is based. The meta-plot contains information on the statistical power of the primary studies, statistical significance of the primary study effect sizes, and the random-effects estimate of the average effect size including its 95% confidence interval. It also contains the results of a cumulative meta-analysis with respect to precision, yielding a robustness check of the meta-analytic effect size with respect to primary studies’ precision as well as evidence of small-study effects and publication bias. Because of providing these useful pieces of information, we recommend accompanying any meta-analysis of common effect size measures with the meta-plot.
One problem of meta-analyses is the interpretation of small-study effects (Sterne et al., 2011), as signaled by a decreasing trend in the meta-plot. The meta-plot helps with interpreting small-study effects using the percentage of statistically significant primary effect sizes; a low percentage of statistically significant results cannot go together with strong publication bias. All of the meta-analyses with clear evidence of a small-study effect in our paper (the two cherry-picked examples, and Berry et al. (2012), that is, three out of 12 meta-analyses) have more than 90% significant effect sizes, suggesting that publication bias may be the cause of the small-study effects. The two cherry-picked examples illustrate that small-study effects can be fully explained by publication bias, and that heterogeneity of effect sizes is not needed to explain the results. Publication bias also explains at least part of the decreasing trend in Berry et al., but the trend may also reflect heterogeneity of effect size as the cumulative meta-analysis shows that small studies yielded relatively large effect sizes.
These three examples also show how publication bias, average effect size, and heterogeneity of effect size may interact in complex ways (Augusteijn et al., 2019; Jackson, 2006), and suggest that statistics is not the be-all and end-all when interpreting the small-study effect. We recommend examining the designs and studies that gave rise to the primary study effect sizes. Meta-analyses in psychology typically report large heterogeneity (Van Erp et al., 2017) probably because they incorporate studies with widely varying designs, variables, and measures, whereas meta-analyses of multi-lab direct replication studies mostly find no heterogeneity and seldom substantial heterogeneity (Klein et al., 2018; Olsson-Collentine et al., 2020). Hence, small-study effects are less likely to be caused by heterogeneity in meta-analyses of very similar studies than when the meta-analysis includes studies that may differ in many respects.
The meta-plot also has some limitations. First, the meta-plot provides no useful information on two important elements of the meta-analysis; heterogeneity of effect sizes and possible moderator effects. The meta-plot is a graphical tool providing information on the average effect size estimate, including a robustness check and a check if publication bias may alternatively explain this average estimate. For assessing heterogeneity and how its assessment is affected by and robust to publication bias we refer to the Q-plot (Augusteijn et al., 2019). Moderator effects are, in our opinion, best assessed and tested using statistics rather than using a graphical tool, although the meta-plot can also be applied to a subset of studies based on scores on a moderator. A second limitation is that the meta-plot currently can only be applied to common effect size measures Hedges’ g, Pearson’s correlation, and the odds ratio. Extending the meta-plot to other effect size measures is an opportunity for future research. Third, the meta-plot only examines the possible effect of publication bias where this bias is the unidirectional suppression of statistically nonsignificant effect sizes. Evidence of other types of publication bias cannot be detected with the meta-plot because these types do not result in a specific trend in the effect size estimates of the cumulative meta-analysis.
Fourth, p-hacking in the primary studies may distort the meta-plot. For example, not reporting all dependent measures of a primary study, likely one of the most prevalent p-hacking behaviors (John et al., 2012), will yield an overestimated effect size if only the measure with the largest effect size gets reported. This is also an alternative explanation for observing estimates of the cumulative meta-analysis that are larger than the expected effect size under extreme publication bias and no effect (i.e., black stars in the meta-plot). Note that p-hacking distorts the results of all meta-analysis and publication bias methods (e.g., Carter et al., 2019; Ulrich & Miller, 2015; van Aert et al., 2016), so this is not a problem of the meta-plot in particular. Fifth, estimation of the between-study variance in a random-effects meta-analysis is known to be imprecise in case of a small number of effect sizes in a meta-analysis (Chung et al., 2013; Kontopantelis et al., 2013; Sidik & Jonkman, 2007). This also affects the results of the first steps of the cumulative meta-analysis (i.e., the average effect size estimate and its confidence interval) that are shown in the meta-plot. Finally, the meta-plot does not include statistical tests in addition to those of cumulative meta-analysis. However, this is by design; as tests often make strong assumptions and have limited power, we chose not to incorporate statistical tests in the meta-plot.
Although we believe the meta-plot has substantial added value to a meta-analysis in its own right, the meta-plot may also assist in meta-research. Meta-research is the study of research itself: its methods, reporting, reproducibility, evaluation, and incentives (Ioannidis, 2018). Output of the meta-plot directly provides information on statistical power and statistical significance of research in different fields or disciplines. For instance, concerning power, the meta-plots of the 10 randomly selected meta-analyses from psychology reveal that seven (70%) meta-analyses contain a substantial percentage (28% or more) of studies with insufficient power (less than 80%) to detect a large true effect size, and only one (10%) meta-analysis contains at least one study with sufficient power to detect a small true effect size. Output of meta-plot like this can be further used to analyze the statistical power of studies as a function of field or journal.
The meta-plot also provides essential input for analyses of statistical significance of primary studies and the related issue of publication bias. The literature suggests that around 95% of main results are statistically significant in papers in psychology (Fanelli, 2012), and this was even higher in the selection of papers with four or more experiments in the flagship journal Psychological Science (Francis, 2014). However, these findings starkly contrast with the results of our 10 meta-plots; the median and average number of statistically significant findings are 44.4% and 46.8%, respectively, and only 2 (20%) contain at least 95% significant findings. Our findings are in line with a large review of meta-analyses in Psychological Bulletin (2004–2014), which found that 28.9% of 3,398 primary study effect sizes in meta-analyses were statistically significant (Van Aert et al., 2019). We believe this large disparity between primary study findings in meta-analyses and main results in papers is explained by biases operating on the main result of a paper, but that meta-analyses often also include effect sizes that are of secondary importance in their paper and therefore not or less affected by biases. This reasoning suggests the need for another assessment or test of bias (i.e., publication bias or other biases related to statistical significance), which compares the average effect size of studies where the effect was a primary outcome to the average effect size of studies where it was not.
Conclusion
In summary, we have developed a new user-friendly graphical tool for meta-analysis that assists the meta-analyst in interpreting the results of the meta-analysis. It provides succinct information on statistical power and the significance of primary studies, as well as the results of random-effects meta-analyses and several sensitivity analyses. As the meta-plot fills a similar role to the funnel plot in meta-analytic research but is less subjective and (much) more informative, meta-analysts should consider adding the meta-plot to any meta-analysis.
References
(2011). Applied power analysis for the behavioral sciences. Routledge.
(2010). Meta-analytic choices and judgment calls: Implications for theory building and testing, obtained effect sizes, and scholarly impact. Journal of Management, 37(1), 5–38. 10.1177/0149206310377113
(2011). Does discovery-based instruction enhance learning? Journal of Educational Psychology, 103(1), 1–18. 10.1037/a0021017
(2016). Cumulative meta-analysis by precision as a method to evaluate publication bias. Journal of Dermatological Science, 83(3), 251–253. 10.1016/j.jdermsci.2016.06.001
(2019). The effect of publication bias on the Q test and assessment of heterogeneity. Psychological Methods, 24(1), 116–134. 10.1037/met0000197
(2012). The rules of the game called psychological science. Perspectives on Psychological Science, 7(6), 543–554. 10.1177/1745691612459060
(1994). Operating characteristics of a rank correlation test for publication bias. Biometrics, 50(4), 1088–1101. 10.2307/2533446
(2011). Culturally adapted psychotherapy and the legitimacy of myth: A direct-comparison meta-analysis. Journal of Counseling Psychology, 58(3), 279–289. 10.1037/a0023626
(2012). Do other-reports of counterproductive work behavior provide an incremental contribution over self-reports? A meta-analytic comparison. Journal of Applied Psychology, 97(3), 613–636. 10.1037/a0026739
(2009). Introduction to meta-analysis. Wiley.
(2013). Power failure: Why small sample size undermines the reliability of neuroscience. Nature Reviews Neuroscience, 14(5), 365–376. 10.1038/nrn3475
(2011). A meta-analytic review of internalizing, externalizing, and academic adjustment among children of deployed military service members. Journal of Family Psychology, 25(4), 508–520. 10.1037/a0024395
(2019). Correcting for bias in psychology: A comparison of meta-analytic methods. Advances in Methods and Practices in Psychological Science, 2(2), 115–144. 10.1177/2515245919847196
(2010). How big is a big odds ratio? Interpreting the magnitudes of odds ratios in epidemiological studies. Communications in Statistics, 39(4), 860–864. 10.1080/03610911003650383
(2013). Avoiding zero between-study variance estimates in random-effects meta-analysis. Statistics in Medicine, 32(23), 4071–4089. 10.1002/sim.5821
(1988). Statistical power analysis for the behavioral sciences (2nd ed.). Lawrence Erlbaum Associates.
(2000a). A nonparametric "trim and fill" method of accounting for publication bias in meta-analysis. Journal of the American Statistical Association, 95(449), 89–98. 10.1080/01621459.2000.10473905
(2000b). Trim and fill: A simple funnel-plot-based method of testing and adjusting for publication bias in meta-analysis. Biometrics, 56(2), 455–463. 10.1111/j.0006-341X.2000.00455.x
(1997). Bias in meta-analysis detected by a simple, graphical test. British Medical Journal, 315(7109), 629–634.
(2010). The essential guide to effect sizes: An introduction to statistical power, meta-analysis, and the interpretation of research results. Cambridge University Press.
(2017). Meta-assessment of bias in science. Proceedings of the National Academy of Sciences of the United States of America, 114(14), 3714–3719. 10.1073/pnas.1618569114
(2012). Negative results are disappearing from most disciplines and countries. Scientometrics, 90(3), 891–904. 10.1007/s11192-011-0494-7
(2010). Positive” results increase down the hierarchy of the sciences. PLOS ONE, 5(4), e10068. 10.1371/journal.pone.0010068
(2011). Positive regard. Psychotherapy, 48(1), 58–64. 10.1037/a0022141
(2012). Publication bias in psychological science: Prevalence, methods for identifying and controlling, and implications for the use of meta-analyses. Psychological Methods, 17(1), 120–128. 10.1037/a0024445
(2014). The frequency of excess success for articles in Psychological Science. Psychonomic Bulletin & Review, 21(5), 1180–1187. 10.3758/s13423-014-0601-x
(2011). Evaluating the gold standard: A review and meta-analysis of the structured interview of reported symptoms. Psychological Assessment, 23(1), 95–107. 10.1037/a0021149
(2011). A meta-analysis of the effect of cognitive bias modification on anxiety and depression. Psychological Bulletin, 137(6), 940–958. 10.1037/a0024355
(1998). Fixed- and random-effects models in meta-analysis. Psychological Methods, 3(4), 486–504. 10.1037/1082-989X.3.4.486
(2005). Selection method approaches. In H. R. RothsteinA. J. SuttonM. Borenstein (Eds.), Publication bias in meta-analysis: Prevention, assessment, and adjustments (pp. 145–174). Wiley.
(2000). Fixed effects vs. random effects meta-analysis models: Implications for cumulative research knowledge. International Journal of Selection and Assessment, 8(4), 275–292. 10.1111/1468-2389.00156
(2018). Meta-research: Why research on research matters. PLOS Biology, 16(3), e2005468. 10.1371/journal.pbio.2005468
(2008). Why most discovered true associations are inflated. Epidemiology, 19(5), 640–648. 10.1097/EDE.0b013e31818131e7
(2006). The implications of publication bias for meta-analysis' other parameter. Statistics in Medicine, 25(17), 2911–2921. 10.1002/sim.2293
(2012). Measuring the prevalence of questionable research practices with incentives for truth telling. Psychological Science, 23(5), 524–532. 10.1177/0956797611430953
(2018). Many Labs 2: Investigating variation in replicability across samples and settings. Advances in Methods and Practices in Psychological Science, 1(4), 443–490. 10.1177/2515245918810225
(2013). A re-analysis of the Cochrane Library data: The dangers of unobserved heterogeneity in meta-analyses. PLOS ONE, 8(7), e69930. 10.1371/journal.pone.0069930
(1998). Advantages of excluding underpowered studies in meta-analysis: Inclusionist versus exclusionist viewpoints. Psychological Methods, 3(1), 23–31. 10.1037/1082-989X.3.1.23
(2016). Comparative performance of heterogeneity variance estimators in meta-analysis: A review of simulation studies. Research Synthesis Methods, 8(2), 181–198. 10.1002/jrsm.1198
(2006). The case of the misleading funnel plot. BMJ, 333(7568), 597–600. 10.1136/bmj.333.7568.597
(2004). Cumulative meta-analysis: A new tool for detection of temporal trends and publication bias in ecology. Proceedings Royal Society of London. Biological Sciences, 271(1551), 1961–1966. 10.1098/rspb.2004.2828
(2012). Amitriptyline versus placebo for major depressive disorder. Cochrane Database of Systematic Reviews, (12), Article CD009138. 10.1002/14651858.CD009138.pub2
(2009). Sample sizes and effect sizes are negatively correlated in meta-analyses: Evidence and implications of a publication bias against nonsignificant findings. Communication Monographs, 76(3), 286–302. 10.1080/03637750903074685
(1984). Summing up: The science of reviewing research. Harvard University Press.
(2011). The association between paternal sensitivity and infant-father attachment security: A meta-analysis of three decades of research. Journal of Family Psychology, 25(6), 986–992. 10.1037/a0025855
(1993). A meta-analysis of infant habituation and recognition memory performance as predictors of later IQ. Child Development, 64(1), 57–79. 10.2307/1131437
(2016). Adjusting for publication bias in meta-analysis: An evaluation of selection methods and some cautionary notes. Perspectives on Psychological Science, 11(5), 730–749. 10.1177/1745691616662243
(2011). To read or not to read: A meta-analysis of print exposure from infancy to early adulthood. Psychological Bulletin, 137(2), 267–296. 10.1037/a0021890
(2015). The replication paradox: Combining studies can decrease accuracy of effect size estimates. Review of General Psychology, 19(2), 172–182. 10.1037/gpr0000034
(2020). Heterogeneity in direct replications in psychology and its association with effect size. Psychological Bulletin, 146(10), 922–940. 10.1037/bul0000294
(2015). Estimating the reproducibility of psychological science. Science, 349(6251), aac4716. 10.1126/science.aac4716
(1982). Consensus values and weighting factors. Journal of Research of the National Bureau of Standards, 87(5), 377–385. 10.6028/jres.087.022
(2008). Contour-enhanced meta-analysis funnel plots help distinguish publication bias from other causes of asymmetry. Journal of Clinical Epidemiology, 61(10), 991–996. 10.1016/j.jclinepi.2007.11.010
(2015). No effect of weight on judgments of importance in the moral domain and evidence of publication bias from a meta-analysis. PLOS ONE, 10(8), e0134808. 10.1371/journal.pone.0134808
(2019). How to detect publication bias in psychological research. Zeitschrift für Psychologie, 227(4), 261–279. 10.1027/2151-2604/a000386
(2018). A re-evaluation of fixed effect(s) meta-analysis. RSSA Journal of the Royal Statistical Society: Series A, 181(1), 205–227. 10.1111/rssa.12275
(2014, December 31). The test of insufficient variance (TIVA): A new tool for the detection of questionable research practices. Replicability-Index. https://replicationindex.com/2014/12/30/tiva/
(2007). A comparison of heterogeneity variance estimators in combining results of studies. Statistics in Medicine, 26(9), 1964–1981. 10.1002/sim.2688
(2014). P-curve and effect size: Correcting for publication bias using only significant results. Perspectives on Psychological Science, 9(6), 666–681. 10.1177/1745691614553988
(2014). Meta-regression approximations to reduce publication selection bias. Research Synthesis Methods, 5(1), 60–78. 10.1002/jrsm.1095
(2010). Could it be better to discard 90% of the data? A statistical paradox. The American Statistician, 64(1), 70–77. 10.1198/tast.2009.08205
(2000). Publication and related bias in meta-analysis: Power of statistical tests and prevalence in the literature. Journal of Clinical Epidemiology, 53(11), 1119–1129. 10.1016/S0895-4356(0000242-0
(2011). Recommendations for examining and interpreting funnel plot asymmetry in meta-analyses of randomised controlled trials. British Medical Journal, 343(7818), 1–8. 10.1136/bmj.d4002
(2000). Misleading funnel plot for detection of bias in meta-analysis. Journal of Clinical Epidemiology, 53(5), 477–484. 10.1016/S0895-4356(9900204-8
(2005). In an empirical evaluation of the funnel plot, researchers could not visually identify publication bias. Journal of Clinical Epidemiology, 58(9), 894–901. 10.1016/j.jclinepi.2005.01.006
(2015). P-hacking by post hoc selection with multiple opportunities: Detectability by skewness test?: Comment on Simonsohn, Nelson, and Simmons (2014). Journal of Experimental Psychology: General, 144(6), 1137–1145. 10.1037/xge0000086
(2018). Multistep estimators of the between-study variance: The relationship with the Paule-Mandel estimator. Statistics in Medicine, 37(17), 2616–2629. 10.1002/sim.7665
(2020). puniform: Meta-analysis methods correcting for publication bias (Version 0.2.3). Retrieved from https://CRAN.R-project.org/package=puniform
(2016). Conducting meta-analyses on p-values: Reservations and recommendations for applying p-uniform and p-curve. Perspectives on Psychological Science, 11(5), 713–729. 10.1177/1745691616650874
(2019). Publication bias examined in meta-analyses from psychology and medicine: A meta-meta-analysis. PLOS ONE, 14(4), e0215052. 10.1371/journal.pone.0215052
(2015). Meta-analysis using effect size distributions of only statistically significant studies. Psychological Methods, 20(3), 293–309. 10.1037/met0000025
(2023a). Supplemental materials to “The meta-plot: A graphical tool for interpreting the results of a meta-analysis.” https://doi.org/10.23668/psycharchives.12520
(2023b). Supplemental materials to “The meta-plot: A graphical tool for interpreting the results of a meta-analysis.” https://osf.io/eayfr/
(2017). Estimates of between-study heterogeneity for 705 meta-analyses reported in Psychological Bulletin from 1990-2013. Journal of Open Psychology Data, 5(1), Article 4. 10.5334/jopd.33
(2016). Methods to estimate the between-study variance and its uncertainty in meta-analysis. Research Synthesis Methods, 7(1), 55–79. 10.1002/jrsm.1164
(1995). A general linear model for estimating effect size in the presence of publication bias. Psychometrika, 60(3), 419–435. 10.1007/bf02294384
(2007). Approximate confidence intervals for standardized effect sizes in the two-independent and two-dependent samples design. Journal of Educational and Behavioral Statistics, 32(1), 39–60. 10.3102/1076998606298034
(2010). Conducting meta-analyses in R with the metafor package. Journal of Statistical Software, 36(3), 1–48. 10.18637/jss.v036.i03
(1991). A comparison of several point estimators of the odds ratio in a single 2 x 2 contingency table. Biometrics, 47(3), 795–811. 10.2307/2532640
(1999). Statistical methods in psychology journals: Guidelines and explanations. American Psychologist American Psychologist, 54(8), 594–604. 10.1037//0003-066X.54.8.594
(2011). A two-dimensional approach to relationship conflict: Meta-analytic findings. Journal of Family Psychology, 25(3), 325–335. 10.1037/a0023791
(2011). The cognitive differentiation-integration effort hypothesis: A synthesis between the fitness indicator and life history models of human intelligence. Review of General Psychology, 15(3), 228–245. 10.1037/a0024348
1Often precision is also defined as the reciprocal of the squared standard error. The advantage of defining precision as 1/SE is explained later in footnote 3.
2If the true effect equals zero, statistical power is not defined. As one does not know the true effect size to be estimated in the meta-analysis, we believe it is essential to speak of the “precision of the research summarized in the meta-analysis” rather than the “power of research summarized in the meta-analysis”.
3The squared standard error of the estimate of the (Fisher-z transformed) correlation is approximately 1/N, and of the comparison of two independent population means it is approximately equal to (n1 × n2)/(n1 + n2) (see Appendix A1). Studies’ position on the x-axis is calculated using these approximations of their standard error. Consequently, if we have three studies A, B, C with x-values xA < xB < xC and xC − xB = xB − xA, then the difference in precision between study A and study B is approximately equal to that of study B and study C. Moreover, if on the other hand xB/xA = xC/xB, then the precision (or standard error of the study’s effect size estimate) of study B is the same fraction larger than that of study A, as study C’s is larger than that of Study B.
4In case of correlation effect sizes or two-sample designs with equal groups, “precision x or larger” may also be replaced by “sample size x or larger”.
5Note that discarding 90% of the studies of the meta-analysis may also yield biased average effect size estimates in case of heterogeneous true effect size and negatively affect estimation of the between-study variance.
6For testing the hypothesis of a zero true effect size and extreme publication bias we need the sampling distribution of the effect size under these conditions. The meta-plot presents the expected value of this distribution (by the black stars) but not its variance. The variance of this distribution can be shown to be (usually much) smaller than the variance of the estimated effect size that is used in the calculation of the CI 95 presented in the meta-plot. The reason is that the variance of an individual effect size is now only calculated over that 2.5% of the sampling distribution that exceeds the critical value or statistical significance threshold, rather than of the complete sampling distribution. Consequently, CI95 presented in the meta-plot is (usually much) wider than that derived from a zero true effect size in combination with extreme publication bias. Hence, one can safely reject the hypothesis of a zero true effect size and extreme publication bias when the CI95 does not contain the dashed line because the actual CI 95 is smaller (i.e., the two-tailed p-value of the test is certainly lower than .05). As a final note, we could also have implemented the appropriate test of the null-hypothesis of a zero true effect size and extreme publication bias as the variance of the sampling distribution can be analytically derived, but we chose not to do so as our goal was to provide a descriptive tool and because this particular null-hypothesis is non-standard.
7As the calculation of black stars assumes that all studies are statistically significant, it is not fair to compare the expected value of the effect size assuming statistical significance (black stars) to the average effect size based on a set of studies where many are nonsignificant. That is, when the true effect size is small and publication bias is weak, the average effect size may be lower than the black stars, falsely suggesting that there may be publication bias. Hence, the meta-plot only compares the black stars to results of meta-analyses with a reasonably high proportion of statistically non-significant studies. The percentage of 80 allows for 0, 1, 2 (etc.) non-significant studies in a meta-analysis containing 2–4, 5–9, 10–14 (etc.) studies, respectively.